. 2016 Jan 14;5:e09100. doi: 10.7554/eLife.09100

Figure 6. Synchronized NF-κB dynamics translates into functionally different dynamical patterns of gene expression, each corresponding to distinct pathways.

(A) Clusters 1–6 were obtained by an unsupervised k-means-like clustering from the genome-wide transcription profiling of samples harvested in the experiment shown in Figure 5A. Line colours are indicative of the membership value of each gene (colour scale at the bottom). Three clusters contain genes with increasing expression (1–3) and three with decreasing expression (4–6). On the y-axis, standardized expression profile in arbitrary units (see Materials and methods). (B) Plots show single-gene mRNA traces (median: thick blue line; 85% and 15% intervals, thin blue lines). The time courses can also be fitted using our minimal mathematical model: shown is the median of the single-gene fits (thick red line) and the 85% and 15% intervals (thin red lines). Fittings were performed using the same parameters for the external signal (PS) and the dynamics (PNF-κB) as in Figure 5, but using different gene expression parameters PG for each gene. (C) Top five pathways of hierarchical level 2 and 3 in the Reactome database significantly enriched in each dynamical cluster. Dot sizes are proportional to the percentage of genes in the cluster belonging to that pathway. Dot colours identify the corresponding p-values (p-value < 0.05 is set as threshold). Scale bars on the right. (D, E) Heatmaps shows the degree of overlap at gene level (D) and pathway level (E) between each of the 6 clusters. Colour scale bar on the right. Figure supplements from 1 to 6 are provided.

DOI: http://dx.doi.org/10.7554/eLife.09100.037

Figure 6.

Figure 6—figure supplement 1. Transcription in cells chronically stimulated with TNF-α. .

Figure 6—figure supplement 1.

Four clusters are obtained from the standardized gene expression profiles for cells stimulated with a constant concentration of 10 ng/ml TNF-α. Each line represents a gene. Lines colors: blue and red indicate low and high membership values, respectively.
Figure 6—figure supplement 2. Mathematical validation of clustering. .

Figure 6—figure supplement 2.

(A) Minimal inter-centroid distance as a function of the number of clusters considered for Figure 6 . (B) Principal Component Analysis based on two components segregates clusters containing genes with increased transcription (1, 2 and 3) from those with decreased transcription (4, 5 and 6).
Figure 6—figure supplement 3. Cluster enrichment analysis for NF-κB targets in genes clustered and displayed in Figure 6. .

Figure 6—figure supplement 3.

Tf=180 with T1=30 min and T2=150 min. Two lists of NF-κB targets were considered. (A) Gilmore’s web-site (www.bu.edu/nf-kb/), (B) from (Li et al., 2014). Significance is shown as -Log10(p-value), a dashed line marks the threshold of significance at p=0.05.
Figure 6—figure supplement 4. Cluster enrichment analysis for NF-κB targets in genes clustered and displayed in Figure 7 (constant stimulation).

Figure 6—figure supplement 4.

Two lists of NF-κB targets were considered: (A) Gilmore’s web-site (www.bu.edu/nf-kb/). (B) from (Li et al., 2014). Significance is shown as –Log10(p-value), a dashed line marks the threshold of significance at p=0.05.
Figure 6—figure supplement 5. Distribution of fitting distances.

Figure 6—figure supplement 5.

Distance distribution for single-gene fittings of genes with increased (left) or decreased (right) transcription in cells stimulated with a period of 180 min.
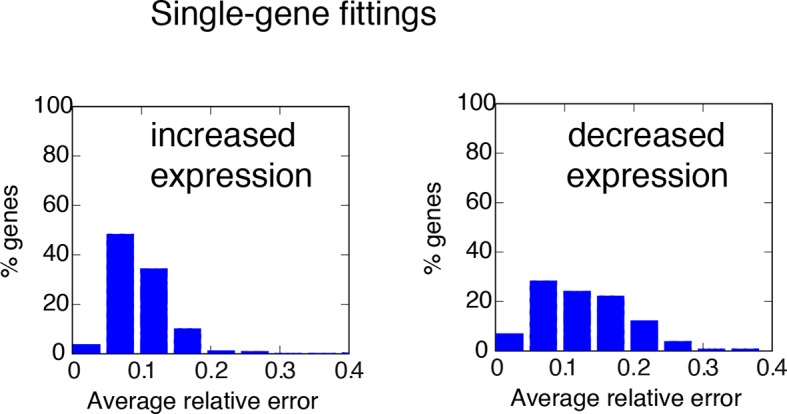
Figure 6—figure supplement 6. Degradation rates values are the key parameter to reproduce different gene expression patterns. .

Figure 6—figure supplement 6.

Upper panels: RNA degradation rates inferred from our model for the gene clusters, for a period of 180 min. Lower panels: example fittings of two genes for each cluster. Of note, the degradation rate is very high for oscillating genes in Cluster 1. Clusters 2 and 3 containing genes with “rapidly-increasing and slowly-decreasing” transcription or “slowly-increasing” transcription are characterised by degradation rates two orders of magnitude lower. Genes with decreasing transcription and belonging to Clusters 4–6 have very low RNA degradation rates.
Figure 6—figure supplement 7. Fitting of transcription data from the 180 min synchronization experiment with an alternative model of transcription.

Figure 6—figure supplement 7.

The data were also fitted using a model in which IκBα (A) does not act as a transcriptional repressor in the feedbacks nor (B) in the expression of each single gene, while the role of NF-κB as transcriptional activator (green arrows in (A)) is preserved. (C) Gene expression data from the experiment in Figure 6 were fitted using the models of (A) and (B) analogously to our fittings of Figures 5 and 6 : with a common set of PNF-κB while each gene is fitted with its own PG. Again, the average relative error is lower for up-regulated genes. (D) Plots show single-gene traces (grey) of all mRNA (median: thick blue line; 85% and 15% intervals, thin blue lines). We show the median of the single-gene fits (thick red line) and the 85% and 15% intervals (thin red lines). (E) Histograms on the bottom part show the distribution of the degradation rates obtained from the fitting for each dynamical cluster. Here, again we have that the degradation rate is the key parameter to reproduce the gene expression patterns observed.