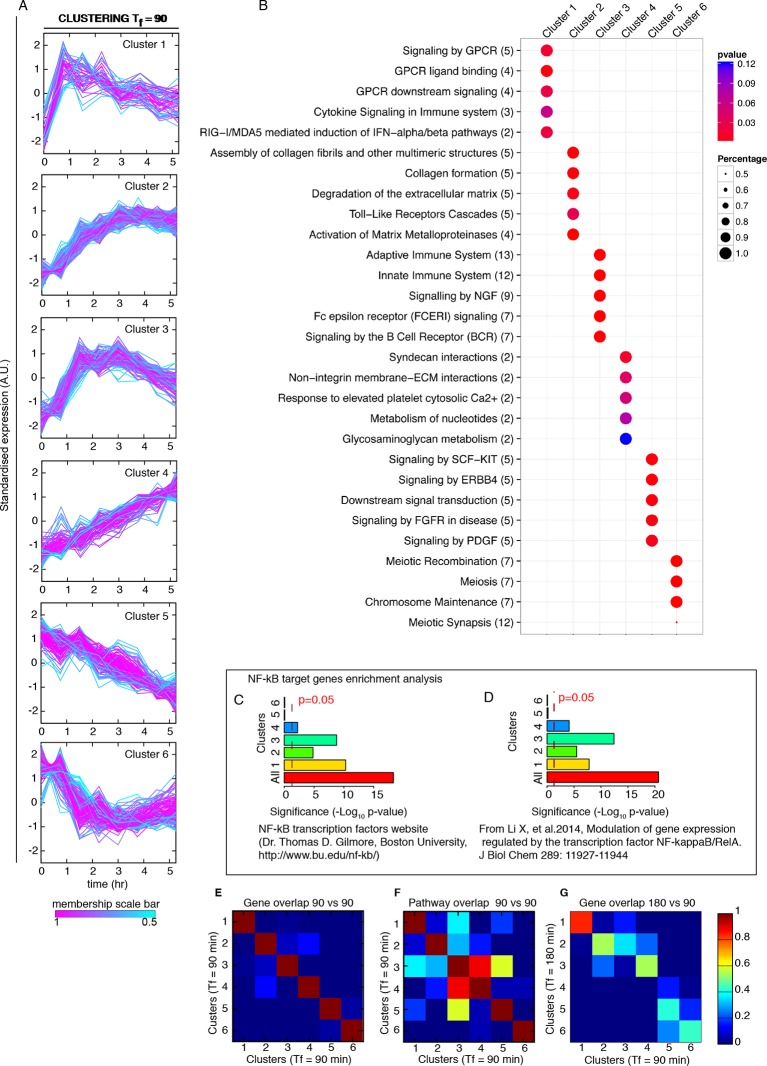
Figure 7. Genome-wide clustering for Tf=90 min.
(A) Clusters obtained by unsupervised k-means clustering from the genome-wide transcription profiling of cells perturbed with a forcing of 90 min, D1=10 and D2=0 ng/ml of TNF-α. Lines colours: blue and red indicate low and high membership values, respectively. (B) Top five pathways of hierarchical level 2 and 3 in the Reactome database significantly enriched in each dynamical cluster. Dot sizes are proportional to the percentage of genes in the cluster belonging to that pathway. Dot colours identify the corresponding p-values (p-value<0.05 is set as threshold). Scale bars on the right. (C, D) Enrichment analysis for NF-κB targets from the clusters displayed in panel A. Two lists of NF-κB targets were considered: left: Gilmore’s web-site (www.bu.edu/nf-kb/); right: data from Brasier and Kudlicki groups (Li et al., 2014). Significance is shown as -Log(p-value), a dashed line marks the threshold of significance at p=0.05. (E, F) Heatmaps show the degree of overlap at gene level (E) and pathway level (F) between each of the 6 clusters. (G) Overlap at a gene level between clusters obtained for 180 min and for 90 min. It is particularly high for Clusters 1, those of oscillating genes. Colour scale bar on the right. Figure supplement 1 is provided.
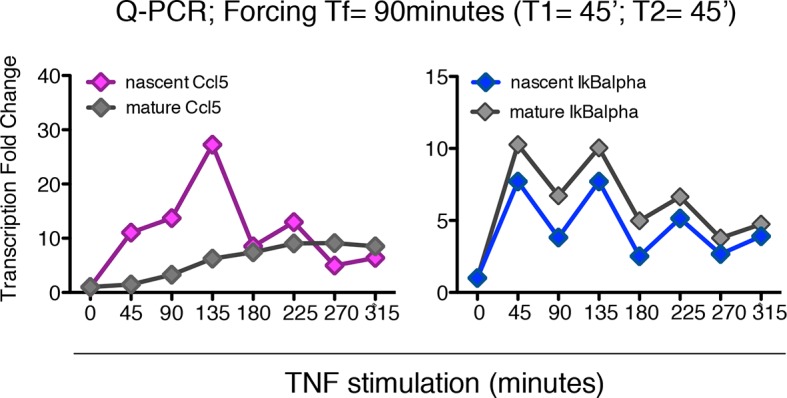
Figure 7—figure supplement 1. Synchronous NF-κB oscillations arising with 90 min forcing lead to population-level coordinated transcription. .


