. 2016 Feb 1;5:e12192. doi: 10.7554/eLife.12192

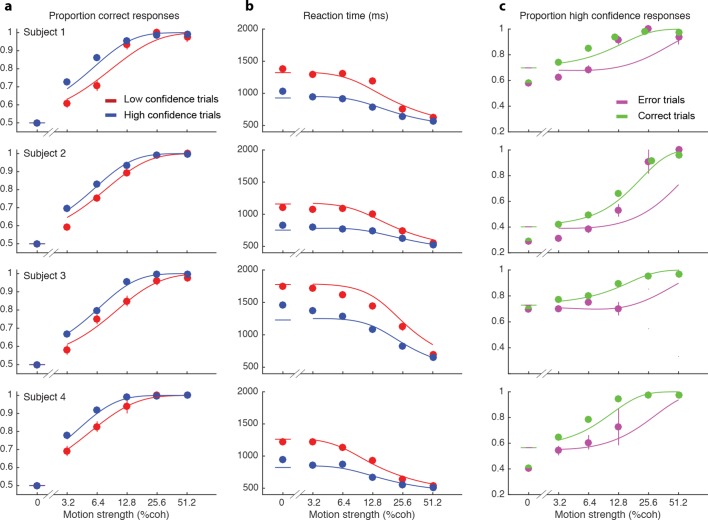
Figure 2. Interplay between initial confidence, accuracy, and reaction time.

(a) Proportion correct responses as a function of motion coherence split by high (blue) and low (red) confidence decisions. (b) Mean reaction time as a function of motion strength as in (a). (c) Probability of a high confidence initial choice as a function of motion coherence, split by correct (green) and error (magenta) trials. Data are means and s.e.m.; curves are model fits. Only data with 10 or more trials are plotted. For clarity some of the points have been jittered horizontally.

DOI: http://dx.doi.org/10.7554/eLife.12192.004

Figure 2.

Figure 2—figure supplement 1. Initial choice behavior for Subject 5.

Figure 2—figure supplement 1.

Data and fits in the same format as Figure 2. This subject responded with high confidence on over 95% of trials.
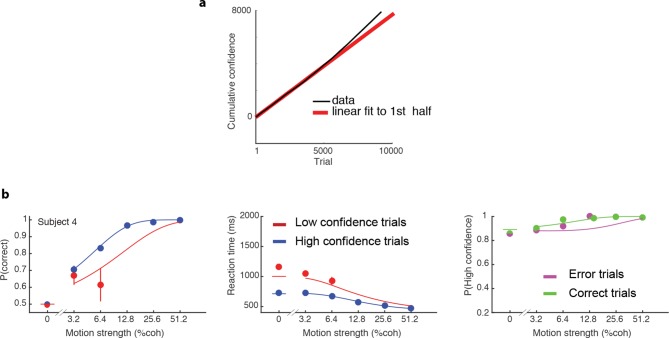
Figure 2—figure supplement 2. Non-stationary behavior of Subject 4.

Figure 2—figure supplement 2.

(a) Cumulative of number of trials with high confidence (back line) as a function of trial number shows a change in slope around trial 5000, corresponding to an increase in the rate of responding with high confidence. Red line shows linear regression fit to the first 5000 trials. (b) Data and fits for trials of this subject’s data in the same format as Figure 2.