. 2016 Feb 1;5:e12192. doi: 10.7554/eLife.12192

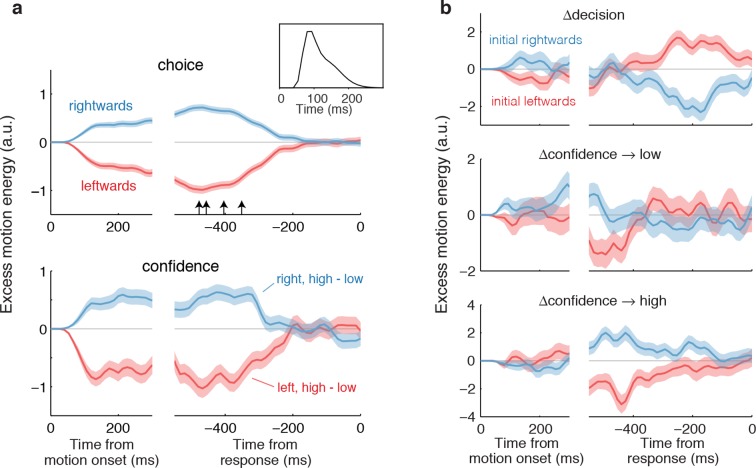
Figure 4. Influence of motion information on choice and confidence.

(a) Stimulus information supporting initial choice and confidence coincide. Motion-energy residuals were obtained by applying a motion energy filter to the sequence of random dots presented on each trial, and subtracting the mean of all trials having the same coherence and direction of motion. Positive (negative) residuals indicate an excess of rightward (leftward) motion. In each panel, data are aligned to stimulus onset (left) and movement initiation (right). Only motion coherences ≤6.4% are included in the analysis. Inset shows the impulse response of the motion filter to a two-stroke rightward motion “impulse” at = 0. The upper panel shows the average of the motion energy residuals for rightward (blue) and leftward (red) choices, irrespective of confidence level. Arrows indicate, for each subject, the time prior to the movement initiation when the motion energy fluctuations cease to affect choice. The estimates correct for the delays of the filter (see Figure 4—figure supplement 1). The lower panel shows the difference in motion energy residuals between high and low confidence, for each direction choice. Shading indicates s.e.m. (b) Influence of motion energy residuals on changes of mind about direction and confidence. When subjects changed their initial decision about direction (top panel), motion information changed sign just before movement initiation. When confidence changed from high to low (middle panel), residuals were positive or negative for the two direction choices, respectively, and attenuated or reversed sign just before movement initiation. In contrast, late information provided additional support for the initial choice when confidence changed from low to high (bottom panel).

DOI: http://dx.doi.org/10.7554/eLife.12192.010

Figure 4.

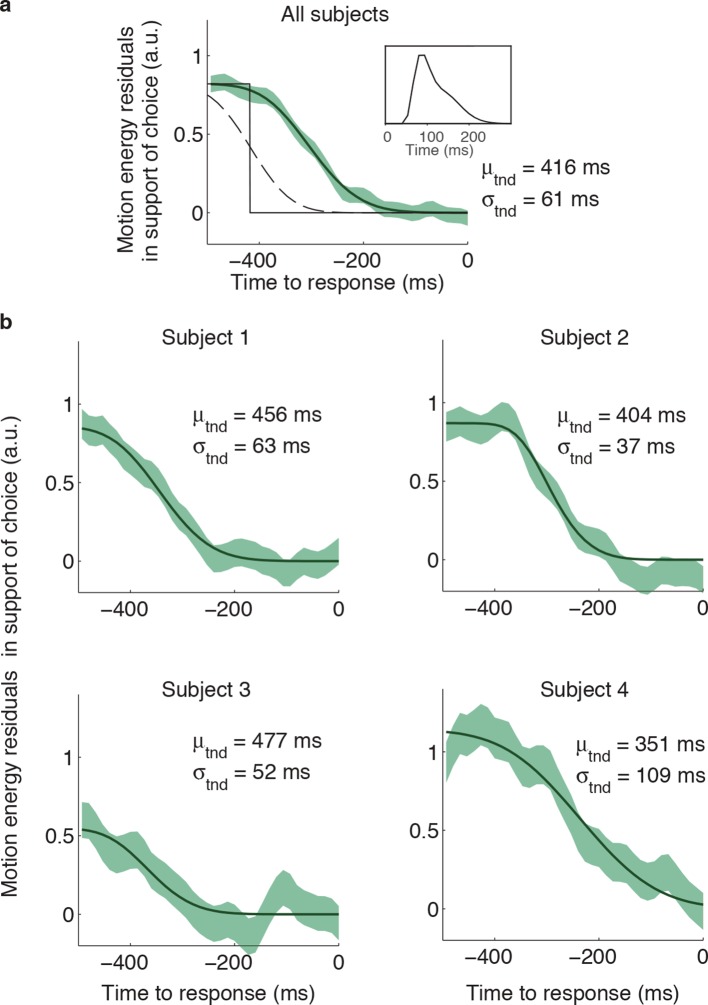
Figure 4—figure supplement 1. Estimation of the non-decision times from the psychophysical kernels.

Figure 4—figure supplement 1.

Although some previous studies measured the non-decision time as the point in time at which motion fluctuations no longer exert a significant influence on the initial choice, this method is biased because estimates of latency become shorter if non-decision times are more variable across trials, or if more trials are included. We used an alternative approach, which involves fitting a function, f(t), to the psychophysical kernels. (a) The shape of f(t) was derived assuming that the slow decay of the psychophysical kernels when aligned on movement onset is due to: (i) trial-to-trial variability in the non-decision time, and (ii) the smoothing introduced by the impulse response of the motion energy (inset; same as in Figure 4a). Without these influences, the influence of motion fluctuations on choice would step to zero at a fixed latency (μtnd) before movement (black solid line). Inter-trial variability in the non-decision time reduces the number of trials that contribute to the psychophysical kernel for times closer to movement onset. If this variability is assumed Gaussian, the step function is smoothed into a cumulative Gaussian (g[t μtnd, σtnd]; dashed line). To fit the psychophysical kernels, we also need to consider the additional smoothing introduced by the motion filter, which we do by convolving g(t) with the impulse response of the motion filter, IR(t), such thatf(t)=αg(t|μtnd,σtnd)*IR(t), where is α is an arbitrary scaling parameter. The final fit, that is f(t), is shown by the black line. To increase the statistical power, we combined the motion energy residuals from rightward and leftward choices, such that positive residuals indicate an excess of motion in the direction of the initial choice. The green shaded area represents s.e.m. for the average of the motion energy residuals, including trials from all subjects. We fit μtnd, σtnd and α to minimize the deviance between f(t) and the average of the motion energy residuals. The best-fitting parameters μtnd and σtnd are indicated in the panel. (b) Same analysis as in (a), but conducted separately for each subject. Latencies are similar to those obtained by fitting a bounded accumulation model (Table 1).