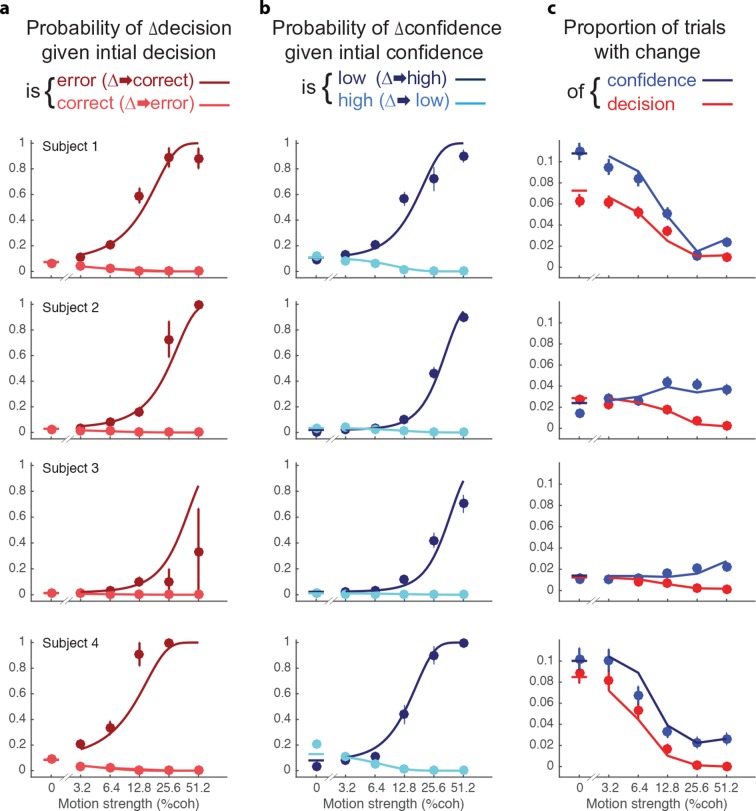
Figure 5. Changes of confidence and decision.
(a) Probability of changes of decision when the initial decision was an error (dark red) or correct (light red) as a function of motion strength. Circles show subject data (mean ± s.e.m) and curves are model fits. (b) Probability of changes of confidence when the initial decision was low confidence (dark blue) or high confidence (light blue) as a function of motion strength. (c) Proportion of trials with changes of confidence (blue) and changes of decision (red) as a function of motion strength. These predictions (curves) are evaluated only at the motion strengths that were presented to the subjects, because they were obtained by using the fits from (a and b) together with the proportion of actual initial choices (error/correct and high/low confidence) for each motion strength. Figure 5—figure supplement 1 shows the empirical and model fit proportion of trials corresponding to panels and (b).
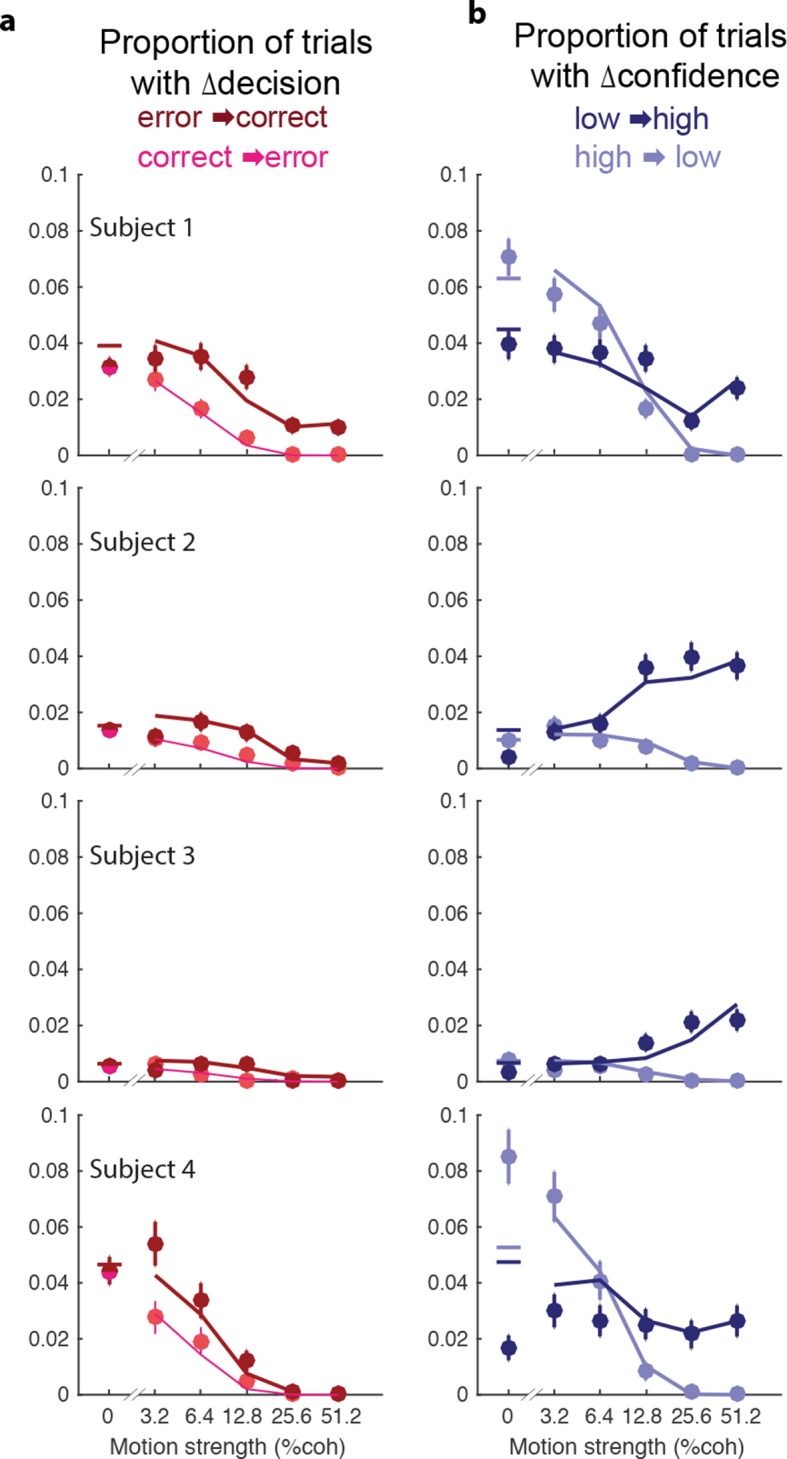
Figure 5—figure supplement 1. Proportion of trials with a change of decision or confidence.


