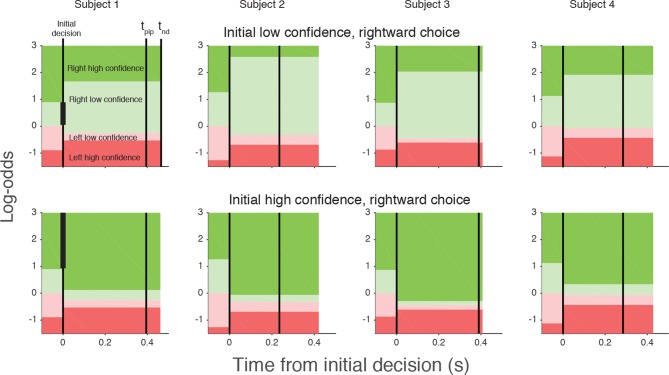
Figure 6. Log-odds thresholds for initial decisions and changes of mind for each participant.
For initial decisions, the confidence threshold ( ± θ for t<0, marked by the boundaries between light and dark colors) determines whether the decision has high or low confidence. The initial direction decision is consistent with the sign of the log-odds (rightward for green and leftward for red). Rows show the thresholds for an initial low- (top) and high- (bottom) confidence rightward decision (i.e., initial decisions that end in the region indicated by the vertical black bar in the plot for Subject 1). Thresholds in the post-initiation stage (right of the initial decision line) tend to “move away” from the initial log-odds threshold, consistent with resistance to change. For all participants, the opposite-choice, high-confidence threshold “moves towards” the initial decision, thereby reducing the width of the pink zone. Because initial confidence was more often high (lower row), the narrow pink zone can be interpreted as resistance to a double change of mind about both direction and confidence. Note that the model parameterization requires the pink and red regions to be same for both initial high and low confidence decisions. The non-decision time (tnd) and time of post-initiation processing (tpip) are also shown for each participant (labels in left top graph).

