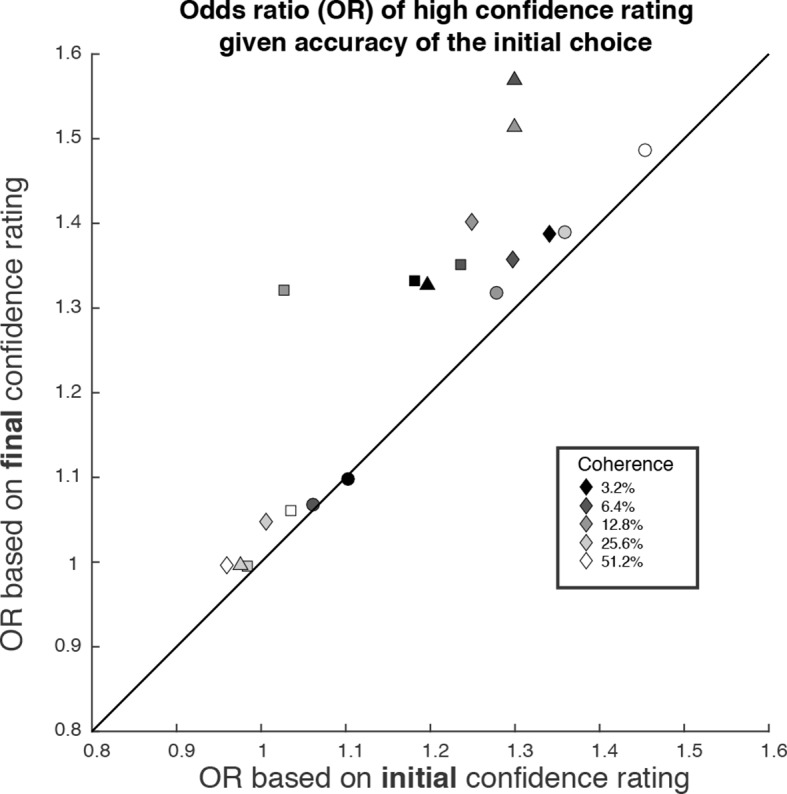
Figure 7. The possibility of change of confidence introduces an apparent dissociation between accuracy and confidence.

The odds ratio (OR) statistic captures the relative tendency to report high confidence on correct versus error trials. The scatter plot compares ORs calculated from the participants’ data using the initial and final confidence report. Both ORs use the correct/error designation for the initial direction decision. The ORs calculated from the initial confidence report establish a baseline: the breakdown of confidence associated with the information that explains the accuracy at each motion strength. The ORs calculated from the final confidence report are larger and might thus be mistakenly interpreted as support for a dissociation between determinants of choice and confidence. Symbol shapes correspond to the four subjects; symbol shading denotes motion strength. An odds ratio can only be calculated if there are error trials (or the ratio is infinite). This necessitated exclusion of one of the points at the highest coherence level.
