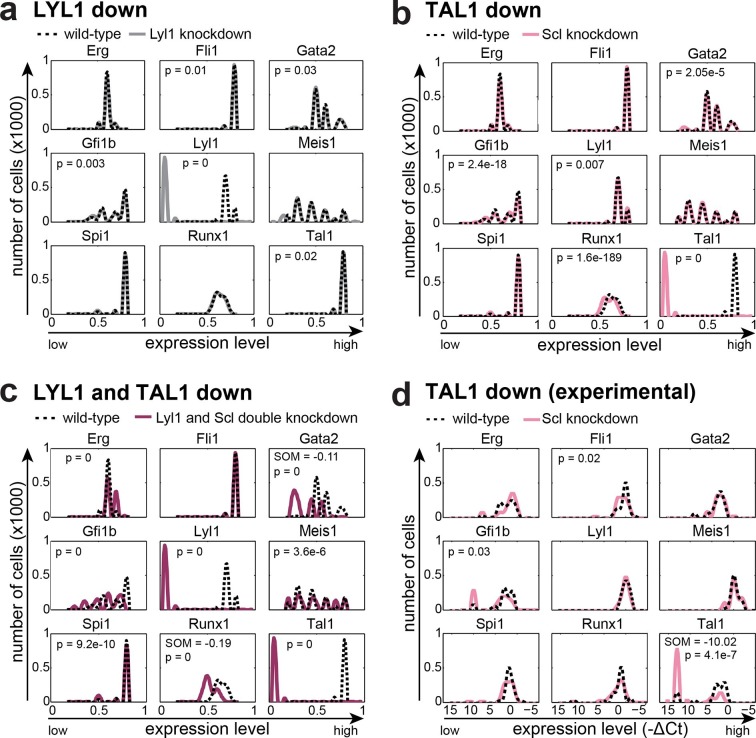
Figure 5. The DBN recapitulates the consequences of TAL1 and LYL1 single and double perturbations as seen in vivo and in vitro.
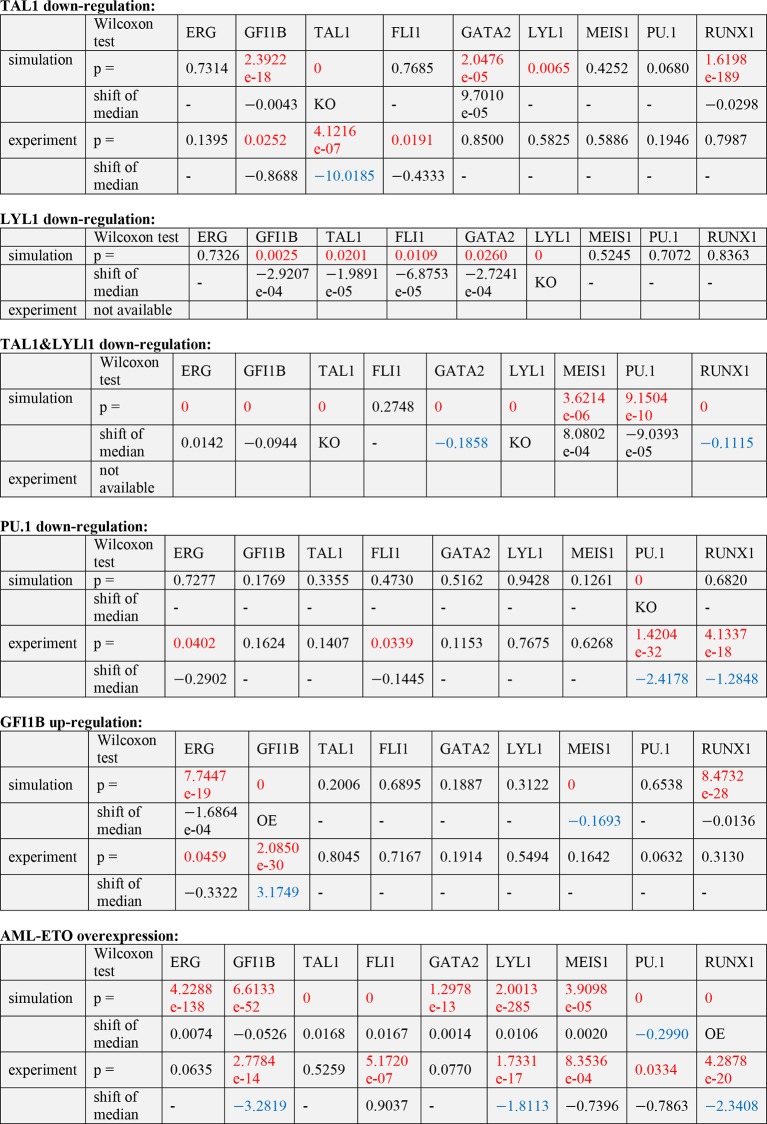
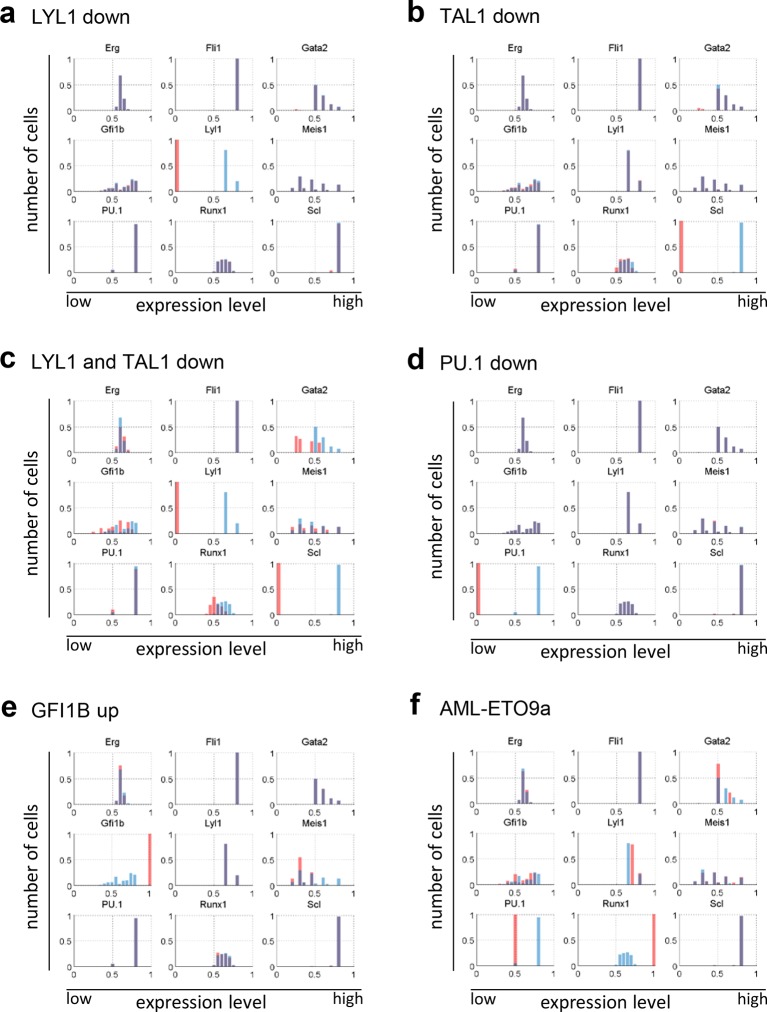
Computational prediction of gene expression patterns for the nine TFs of interest after perturbation of TAL1 (a), LYL1 (b) or both (c). Deletion of TAL1 or LYL1 on their own has no major consequences on the expression levels of the other eight TFs of the gene regulatory network, but simultaneous deletion of both TAL1 and LYL1 caused changes in expression of several genes, mainly a decrease in Gata2 and Runx1. This major disruption of the core GRN for blood stem/progenitor cells is therefore consistent with TAL1/LYL1 double knockout HSCs showing a much more severe phenotype than the respective single knock-outs. One thousand simulations were run for each perturbation to determine the TFs expression levels in a 'cell population' by selecting expression levels at random time points after reaching its initial steady state. Expression levels of 0 resemble no expression, whereas expression levels of 1 stand for highest expression level that is possible in this system. The scale of the x-axes is linear. (d) Gene expression levels measured in single 416b cells transfected with siRNA constructs against Tal1 or a control. The density plots of gene expression levels after perturbation of TAL1 indicate the relative number of cells (y-axes) at each expression level (x-axes). The scale of the x-axes is linear. The values indicate the results of the Wilcoxon rank-sum test: alterations to the expression profiles are indicated by the p-value (statistical significance: p <0.001 for computational data and p <0.05 for experimental data); substantial shifts in median expression level are indicated by the shift of median (SOM) (SOM >0.1 for computational data and >1 for experimental data). For details, see Figure 5—figure supplement 1; for full expression data, see Figure 5—source data 1 .
DOI: http://dx.doi.org/10.7554/eLife.11469.046


