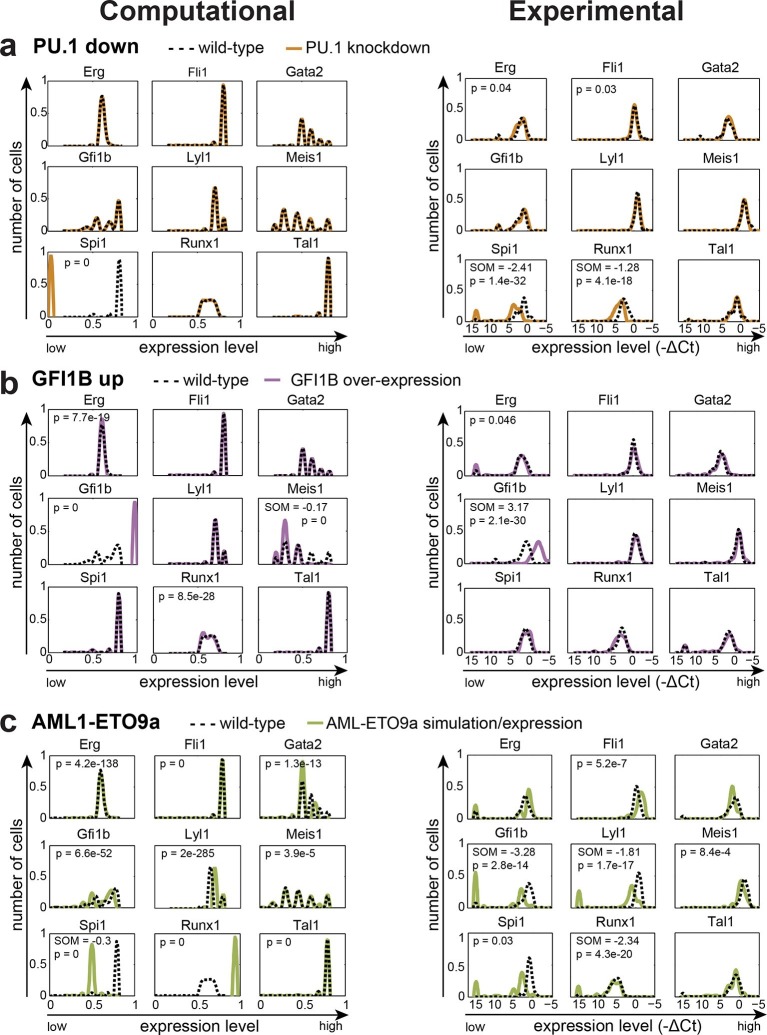
Figure 6. The DBN captures the transcriptional consequences of network perturbations.
Left panel: Computational prediction of gene expression after perturbation of specific TFs. 1000 simulations were run for each perturbation to determine expression levels in a 'cell population' (expression at 0 resembles no expression, whereas expression of 1 represents the highest possible expression level). The scale of the x-axes is linear. Right panel: Density plots of gene expression levels in single 416b cells after perturbation of specific TFs indicating the relative number of cells at each expression level. The scale of the x-axes is linear. The values indicate the results of the Wilcoxon rank-sum test: alterations to the expression profiles are indicated by the p-value (statistical significance: p<0.001 for computational data and p<0.05 for experimental data); substantial shifts in median expression level are indicated by the shift of median (SOM) (SOM >0.1 for computational data and >1 for experimental data). For details, see Figure 5—figure supplement 1. (a) PU.1 down-regulation: (Left) Computational prediction of gene expression after PU.1 knockdown (Spi1 was set to 0 after reaching its initial steady state). (Right) Gene expression levels measured in single 416b cells transduced with shRNA constructs against shluc (wild-type) or shPU.1 (PU.1 knockdown). (b) GFI1B overexpression: (Left) Computational prediction of gene expression after overexpression of GFI1B (Gfi1b was set to 1 after reaching its initial steady state). (Right) Gene expression levels in single 416b cells transduced with a GFI1B-expressing vector compared to an empty vector control (wild-type). (c) Consequences of the AML-ETO9a oncogene: (Left) Computational prediction of gene expression patterns after introducing the dominant-negative effect of the AML-ETO9a oncogene (Runx1 was fixed at the maximum value of 1 after reaching its initial steady state and in addition all Runt binding sites were set to have a repressive effect). (Right) Gene expression levels measured in single 416b cells transduced with an AML-ETO9a expressing vector fused to mCherry. mCherry positive cells were compared to mCherry negative cells (wild-type).
DOI: http://dx.doi.org/10.7554/eLife.11469.050

