. 2016 Jan 14;5:e10644. doi: 10.7554/eLife.10644

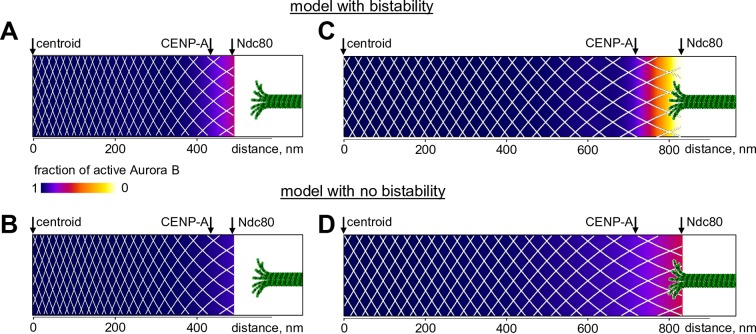
Figure 8. Predicted gradient of Aurora B kinase activity at kinetochores during prometaphase (left) and metaphase (right).

Color-coded plots of the profile of Aurora B kinase activity along the axis connecting the centromere centroid (midway between the sister kinetochores) and the outer kinetochore. Arrow for Ndc80 corresponds to the location of the N-terminus of Hec1 (Wan et al., 2009). Density of the white mesh indicates concentration of Aurora B kinase; local Aurora B concentration is lower when mesh holes are larger. (A) and (B) show model predictions for prometaphase kinetochores that are not under tension (smaller centroid to Ndc80 distance). In metaphase (C and D) this distance increases due to forces generated by the end-on attached kinetochore microtubules. In the model without bistability (B–D), the fraction of active Aurora B kinase simply reflects the total Aurora B kinase concentration.

DOI: http://dx.doi.org/10.7554/eLife.10644.017

Figure 8.

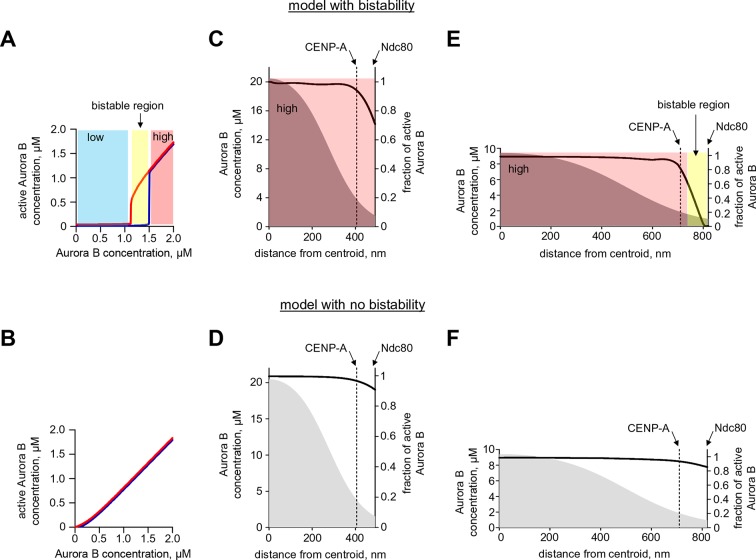
Figure 8—figure supplement 1. Quantification of Aurora B activity gradient during mitosis.

Figure 8—figure supplement 1.

(A,B) Calculated concentration of active Aurora B as a function of total Aurora B concentration in the model with and without bistability. Red and blue curves correspond to the initially active and partially active Aurora B, correspondingly. In the model with bistability (A), Aurora B kinase remains largely inactive ('low' state) until total kinase concentration reaches ~1.2 µM. With higher kinase concentration, the active kinase increases roughly proportionally to the total concentration, but in the range of 1.2–1.5 µM both 'low' and 'high' activity states are possible (bistable region). In the model with no bistability (B), kinase activity increases roughly proportionally to total kinase concentration and the curves for different initial conditions overlap completely (shown with slight offset for better visualization). (CF). Graphs show the calculated fraction of total Aurora B kinase that is active (black solid lines, right axes) as a function of distance along the centromere-kinetochore axis. Shown in grey (left axes) is estimated total concentration of Aurora B kinase. In the model with bistability (C,E), different concentration areas are colored as in panel (A), indicating predicted activity states. Graphs for the less stretched centromere (C,D) correspond to distances observed at the microtubule-free kinetochores in prometaphase. Since total Aurora B (grey areas) is constant during prometaphase and metaphase, centromere stretching (E,F) reduces Aurora B concentration everywhere, and bistability becomes possible at the outer kinetochore (E, yellow-colored area), where active Aurora B concentration drops below threshold. In the spatial region with bistability, a steep gradient of Aurora B activity can form.