
Figure 3. Fate diagram of the model. .
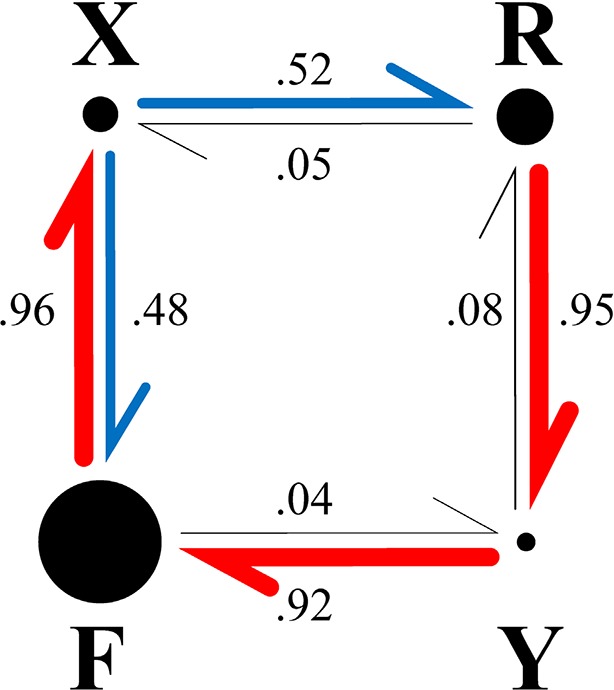
The system typically cycles clockwise through states F, X, R, Y, with state F frequently interrupted by FXF transitions, leading to state sequences of the form …(FX)nRY(FX)nRY…. Nearly unidirectional transitions out of a given state are shown by red arrows; blue arrows indicate nearly equiprobable transitions. The width of the arrows and the numbers beside them show the probability that the transition out of the state at the tail of the arrow is into the state at the head. The area of each circle is proportional to the probability of the corresponding state (Table 1, column A).