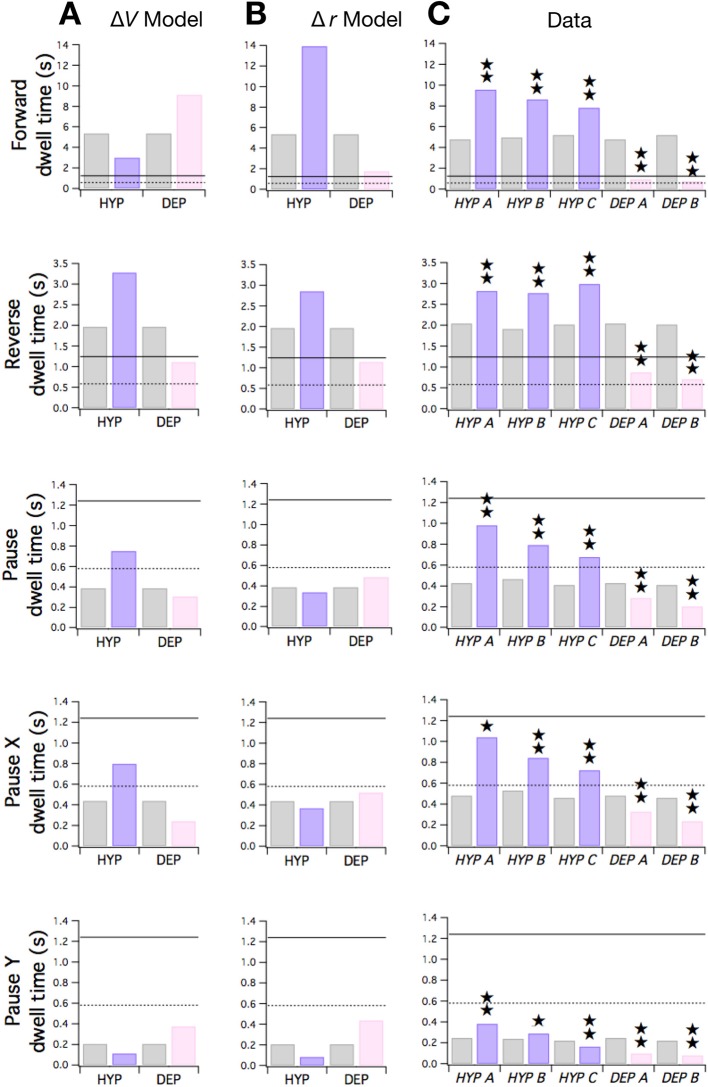
Figure 7. Predicted and observed effects of HYP and DEP mutations on dwell times.
(A) Predicted effects of changes in membrane potential. (B ) Predicted effects of changes in input resistance. (C) Dwell times in F, R, and P for cohorts of HYP mutants, DEP mutants, and wild type animals. Stars indicate significant change in dwell time (p<0.05 without () or with () correction for multiple comparisons; Table 6). In A-C wild type dwell times are indicated by gray bars. Horizontal lines indicate the estimated range of , the dwell time in the uncoupled state. In the ΔV model, terms were made more negative to model HYP mutants and more positive to model DEP mutants by subtracting or adding a constant = 0.6; qualitatively similar results were obtained for 0 < ≤ 0.8. In the Δr model, and terms were scaled by (1 + f) to model HYP mutants and by (1 - f) to model DEP mutants, with f = 0.6; qualitatively similar results were obtained for 0 < f ≤ 1. Strains, HYP A: DA572 eat-4(ad572); HYP B: MT6308 eat-4(ky5); HYP C: KP4 glr-1(n2461); DEP A: VM1136 lin-15(n765); akIs9 [lin-15(+), Pglr-1::GLR-1(A/T)]; DEP B: VM188 lin-15(n765); akEx52[lin-15(+), Pnmr-1::GLR-1(A/T)].

