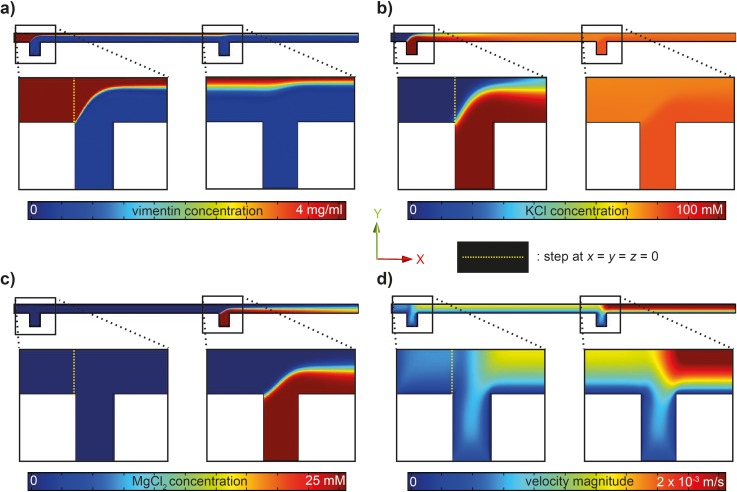
FIG. 2.
FEM simulations of the flow conditions and local concentrations in the microfluidic devices. Simulations shown here are for a vimentin flow speed (central inlet) of 335 μm s−1 (40 μl h−1) and salt buffer flow speeds for each lateral inlet of 310 μm s−1 (80 μl h−1). The mid-plane (x–y) is shown. (a) Vimentin concentration in the device. Enlarged are parts of the inflow of KCl (first cross) and MgCl2 (second cross). The vimentin concentration remains high in the central part, since the large proteins diffuse slowly; the concentration drops from 4 mg ml−1 to about 2 mg ml−1 during the entire length of 10 mm. (b) Change in KCl concentration. KCl is injected at the first cross, diffuses into the central protein stream, and remains at a constant concentration when MgCl2 is injected. (c) Change in MgCl2 concentration. (d) Velocity magnitude.

