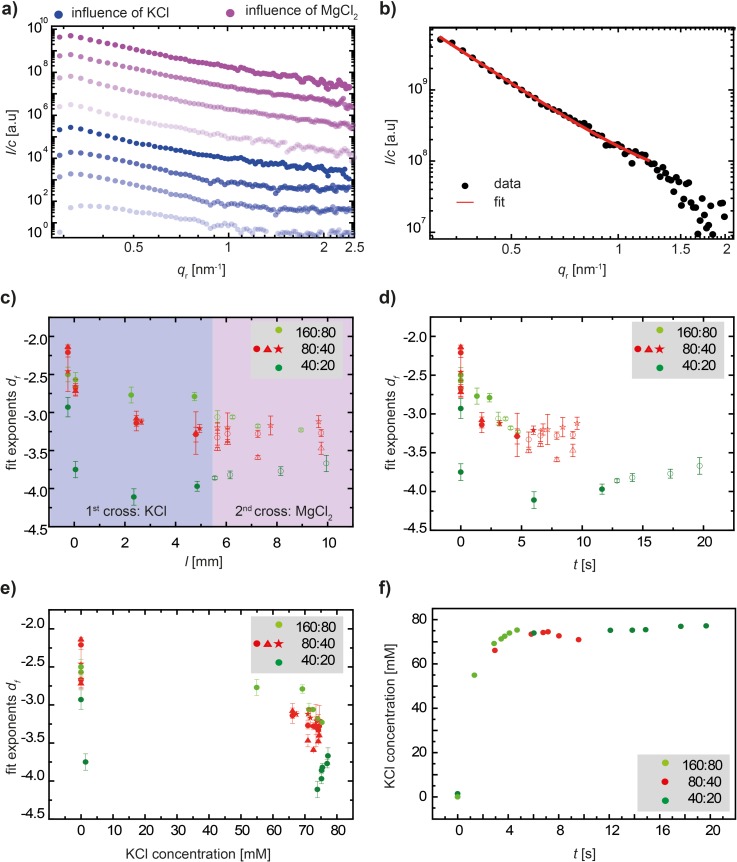
FIG. 5.
Experimental results of SAXS measurements. (a) Double-logarithmic plot of typical scattering curves. The blue data curves refer to vimentin in the presence of only KCl, and the purple curves refer to vimentin in the presence of both KCl and MgCl2. The same color code is used throughout the figure and the text. (b) Representative data curve with the fit to determine power law exponents. (c) Power law exponents df derived from fitting Porod's equation for the intensity decay to the data plotted versus the measurement position in the channel. The legend shows the respective flow speed: first number—lateral buffer inlets, and second number—central vimentin inlet. The closed symbols represent the influence of KCl, and the open symbols represent the influence of MgCl2. In the case of intermediate flow rates (80:40), we show three independent experiments indicated by red circles, triangles, and stars. (d) Fit exponents df plotted versus the time evolved since the “step” position in the device. (e) Fit exponents df plotted versus the KCl concentration, which rapidly jumps from 0 to about 70 mM, as shown in (f).

