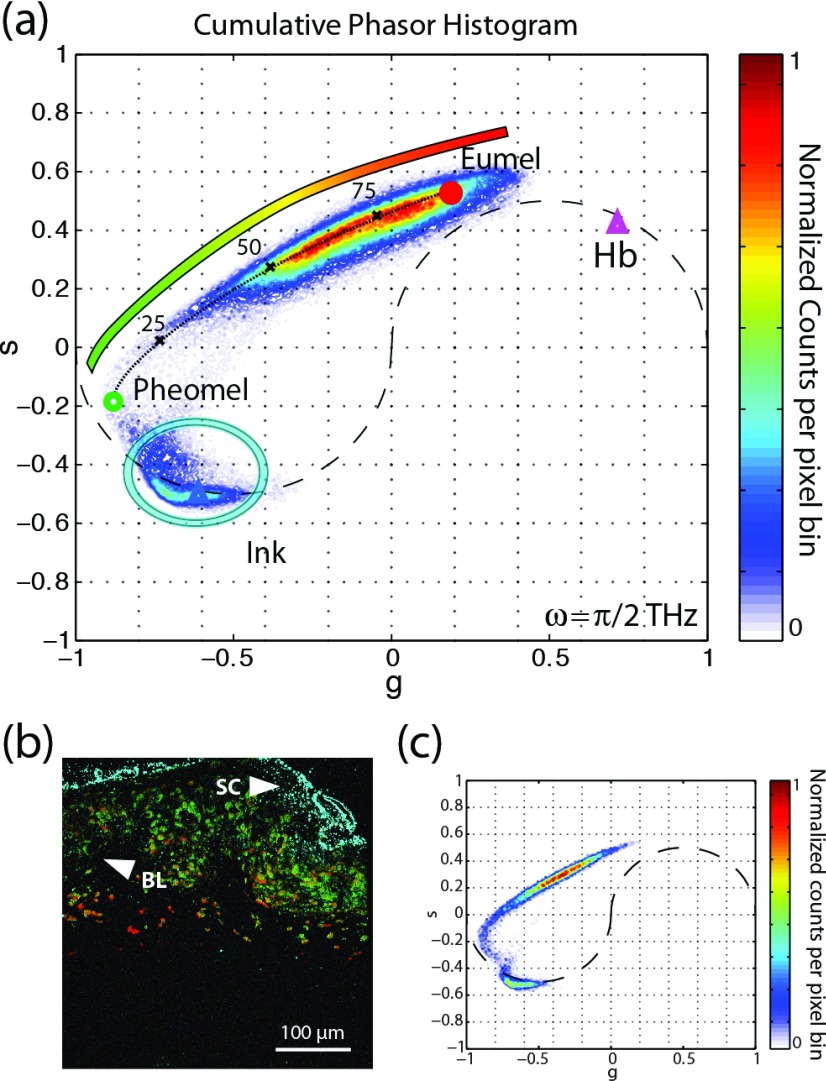
FIG. 9.
(a) Cumulative histogram phasor plot of 42 cutaneous samples. The figure also shows the phasors of standard references of eumelanin (red dot), pheomelanin (green circle), hemoglobin (purple triangle), and surgical ink (blue triangle). The color bar within the figure denotes the color schema used for the image in (b). (b) Representative pump-probe image with colorimetric contrast derived from phasor analysis. (c) Phasor histogram of a representative image in (b). Adapted with permission from Robles et al., Opt. Express 20, 17082 (2012). Copyright 2012 Optical Society of America.

