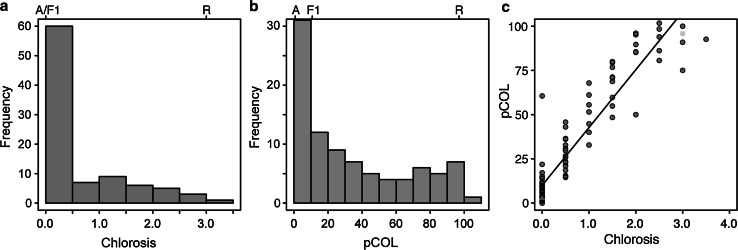
Fig. 2.
Histograms and two-way plot of chlorosis and colonization on the Abed Binder 12 × Russell F2 population inoculated with Pst isolate 08/501. Histograms showing the segregation of chlorosis (a) and pCOL (b) in the F2 population. Parental and F1 phenotypes shown above plots (A Abed Binder 12, R Russell). c Two-way plot showing correlation of chlorosis and pCOL phenotypes. The phenotypes of Abed Binder 12 and Russell are shown as the green triangle and yellow square, respectively

