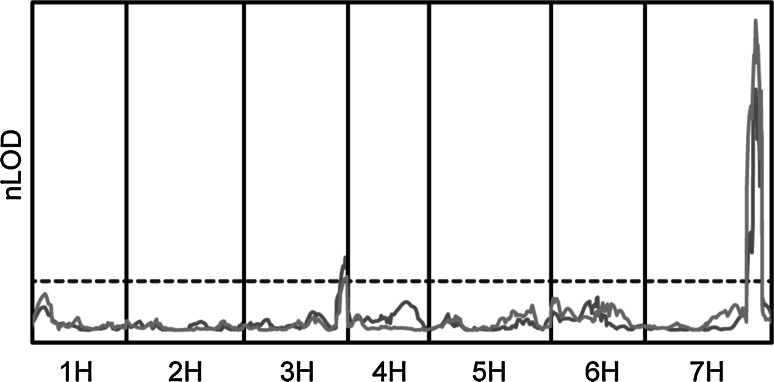
Fig. 3.
Composite interval mapping of chlorosis and pCOL phenotypes in the Abed Binder 12 × Russell F2 population inoculated with Pst. LOD curves were normalized (nLOD) for chlorosis (sky blue) and pCOL (orange) based on individual experiment-wide thresholds (dark blue dashed line) based on 1000 permutations. A step size of 2 cM was used, with the x-axis spanning the length of the AxR-Pst F2 population genetic map

