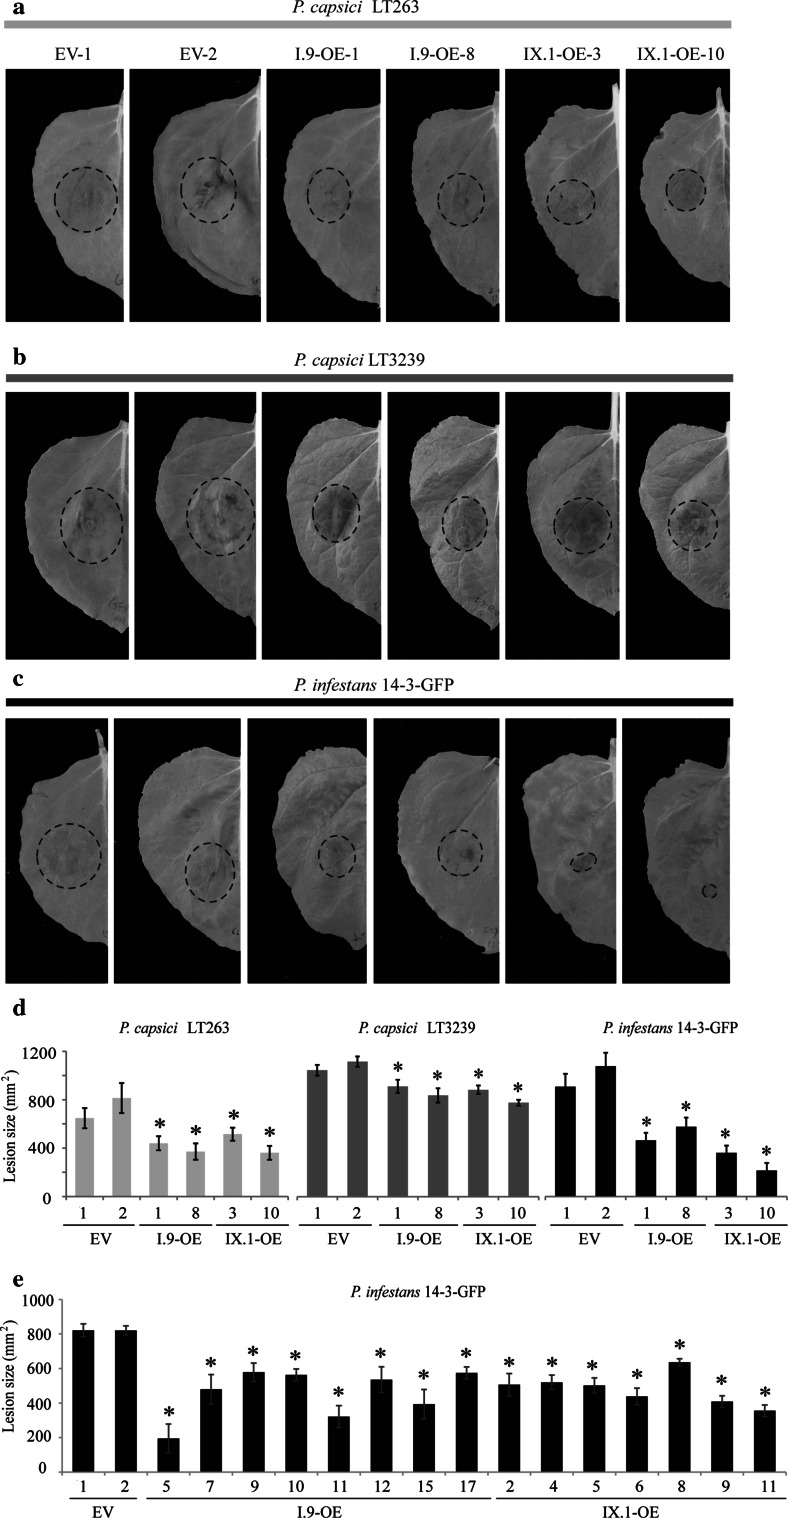
Fig. 4.
Infection assays on transgenic N. benthamiana lines with different Phytophthora pathogens. a–c Disease symptoms on transgenic N. benthamiana EV, I.9-OE and IX.1-OE lines 3 days after plug-inoculation with P. capsici LT263 (a) or LT3239 (b), or 6 days after zoospore-inoculation with P. infestans 14-3-GFP (c). Lesions are indicated by black circles. d Average lesion sizes on N. benthamiana plants upon inoculation with Phytophthora pathogens. Each experiment included 12–20 inoculation sites. Bars represent the mean lesion sizes (±SE). Asterisks indicate significant difference in lesion sizes (p < 0.01) compared to the EV lines based on One-way ANOVA with Tukey’s HSD test. Infection assays were repeated three times with both P. capsici isolates and twice with P. infestans with similar results. e Average lesion sizes on N. benthamiana plants inoculated with P. infestans. Each experiment included 12–20 inoculation sites. Bars represent the mean lesion sizes (±SE). Asterisks indicate significant difference in lesion sizes (p < 0.01) compared to the EV lines based on One-way ANOVA with Tukey’s HSD test. Infection assays were repeated twice with similar results

