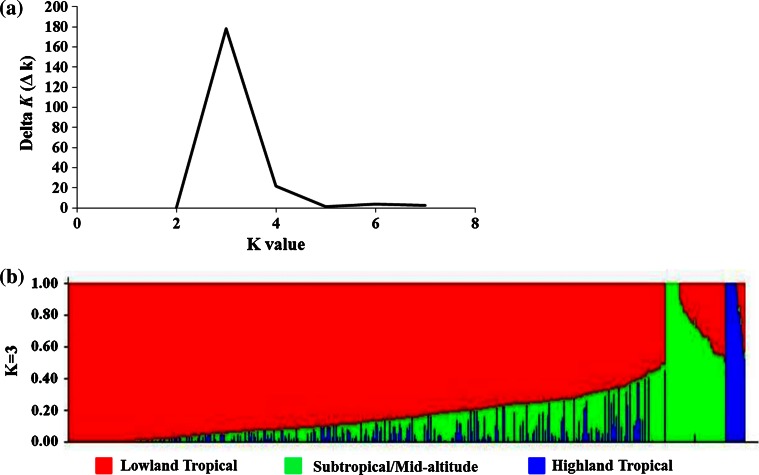
Fig. 4.
Population structure of 538 CMLs estimated with 7497 SNPs. a Delta K values for K ranging from 2 to 7. b Population structure of 538 CMLs when K = 3. Each of the 538 individuals is represented by a thin vertical bar, which is partitioned into K = 3 colored segments on the x-axis, with lengths proportional to the estimated probability membership in each of the K-inferred clusters (y-axis)

