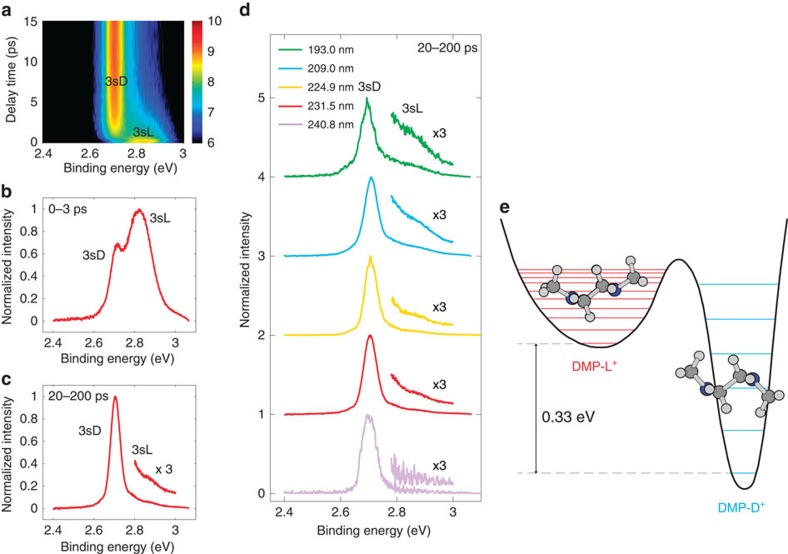
Figure 1. Photoelectron spectra of DMP.
(a) The time-resolved spectrum of DMP with 231.5 nm pump photon. The colour bar represents the logarithmic intensity scale. (b) The 0–3 ps time-integrated spectrum of a. (c) The 20–200 ps time-integrated spectrum of a. (d) The 20–200 ps time-integrated spectra of DMP at five selected pump wavelengths. The relative populations of the charge-localized (3sL) and the charge-delocalized (3sD) states can be determined as a function of temperature from this data, thus providing an estimate of the relative energy of the two states, which turns out to be 0.33 eV. (e) A schematic cut of the potential energy surface for DMP+. The red and blue lines illustrate the vibrational states of DMP-L+ and DMP-D+, respectively.

