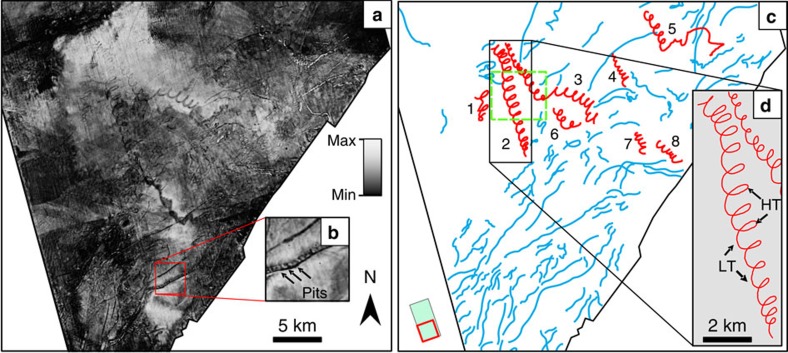
Figure 3. Seismic geomorphology.
(a) Surface peak amplitude map derived from the 3D volume, which highlights the iceberg scours from the MIS 12 deglaciation. Grey scale bar represents the peak seismic amplitude extracted across the 3D surface. For geographic location, see Fig. 1; and for stratigraphic location, see Fig. 2. Enlarged images of the amplitude and depth changes across the surface are provided as Supplementary Figs 1 and 2. (b) Enlarged image of pits formed by the crater chain iceberg. (c) Digitized scour geometry from a. Red digitized scours are those demonstrating variable tidal and geostrophic current effects. Blue lines show linear and curvilinear iceberg scours. Numbers locate scours referred to in the text and Supplementary Table 1. Green dashed box shows the location of Fig. 4. (d) Scour 2 trajectory used for spring tide analysis in Supplementary Fig. 3. HT and LT represent the high and low tides, respectively that were used for estimating tidal and geostrophic current velocities.

