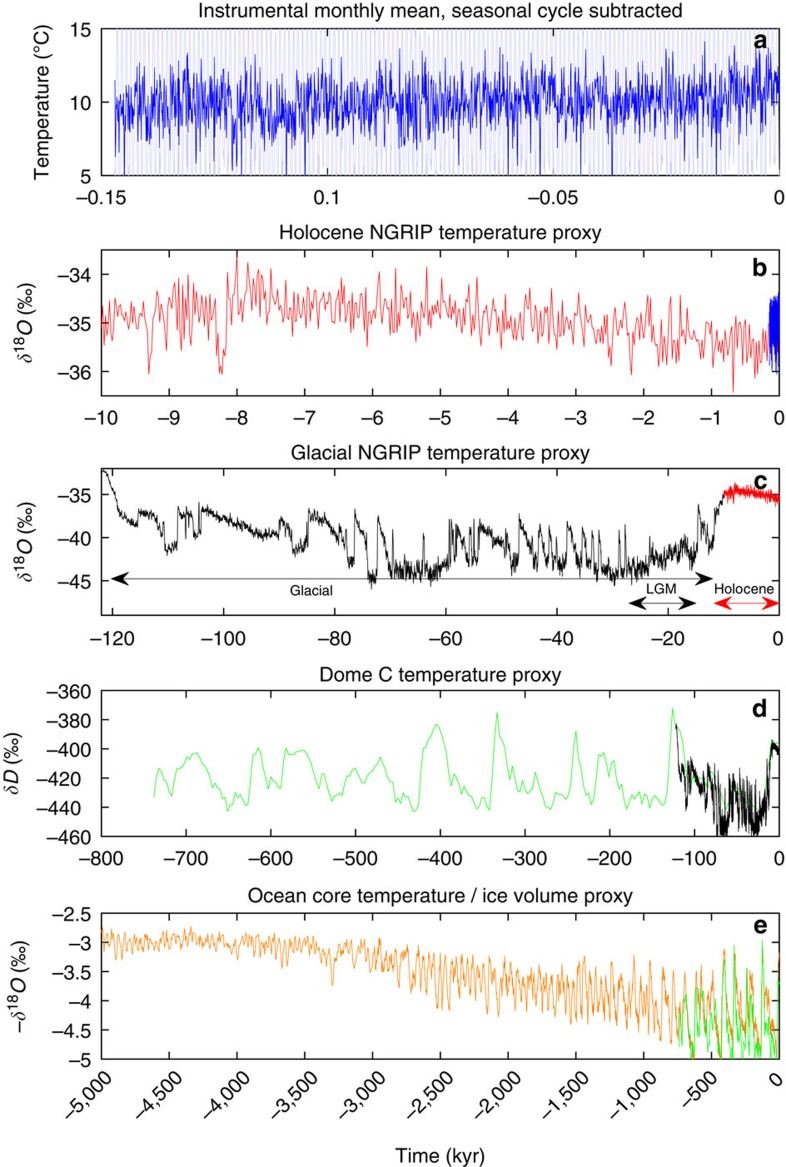
Figure 1. Temperature variations from monthly to geological time scales.
(a) A European meteorological station record (http://www.metoffice.gov.uk/pub/data/weather/uk/climate/stationdata/oxforddata.txt (accessed 2015). URL http://www.metoffice.gov.uk/pub/data/weather/uk/climate/stationdata/oxforddata.txt). ranging over 150 years (light blue, full range not shown). The record with the seasonal cycle subtracted is shown in blue. (b) The Holocene part of the NGRIP isotope record6. The instrumental record normalized to the ice core record (arbitrary) is shown in blue. (c) The full NGRIP record, dated using the ‘GICC05modelext' chronology. The δ18O is a linear proxy for temperature. The warm Holocene period 11.7 kyr to present (red, corresponding to plot (b)) is remarkably stable in comparison with the previous glacial period 12–120 kyr B2K (long black arrow). Before that the end of the previous warm period (Eem) is seen. LGM (15–27 kyr B2K) experienced only one small DO event. (d) The Antarctic EPICA δD record21 spanning almost eight glacial cycles at 3 kyr resolution. The black curve covering the last glacial period is the (normalized) record shown in c. (e) The stacked marine benthic foraminiferal isotope record16 (minus). This is a proxy for global ice volume and global deep ocean temperature. In green is the (normalized) curve in d.

