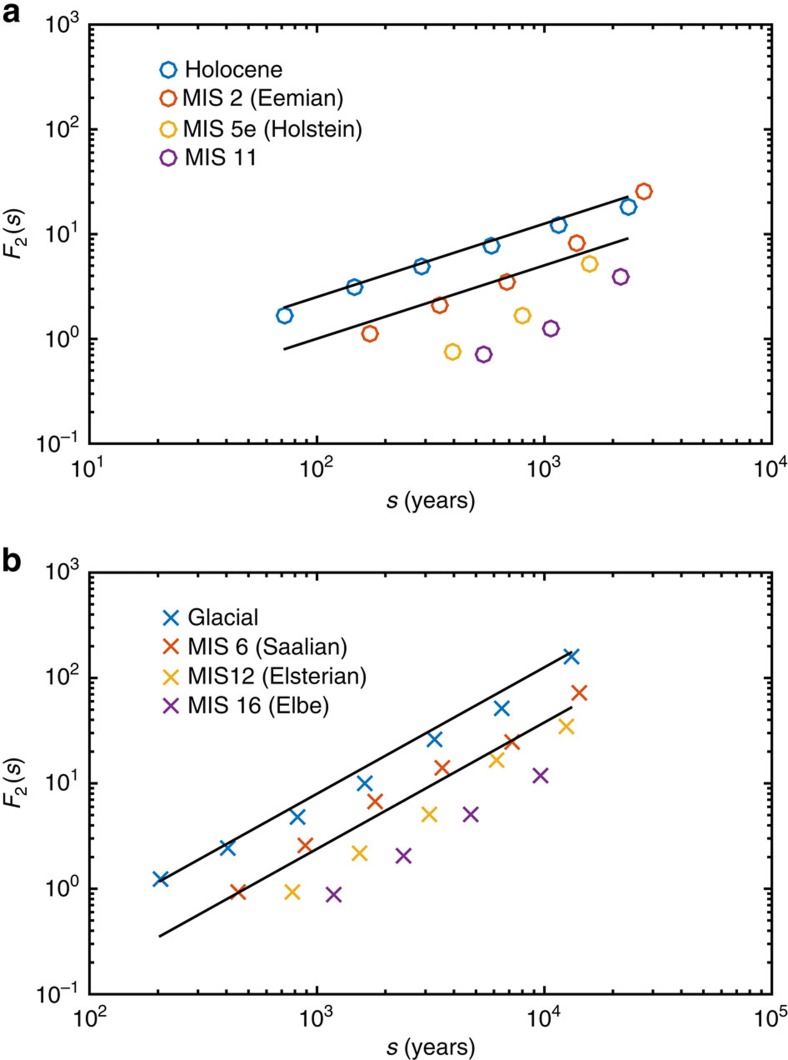
Figure 4. Comparing scaling for interglacial and glacial periods.
The scaling spectra F2(s) for the EDC core split into (a) interglacial periods: Holocene (0–12 kyr BP), MIS 2 (113–130 kyr BP), MIS 5e (235–243 kyr BP) and MIS 11 (321–335 kyr BP); and (b) glacial periods: last glacial (16–113 kyr BP), MIS 6 (136–235 kyr BP), MIS 12 (246–321 kyr BP) and MIS 16 (340-396 kys BP). The straight lines have slopes H2=0.7 for interglacials and H2=1.2 for glacials.

