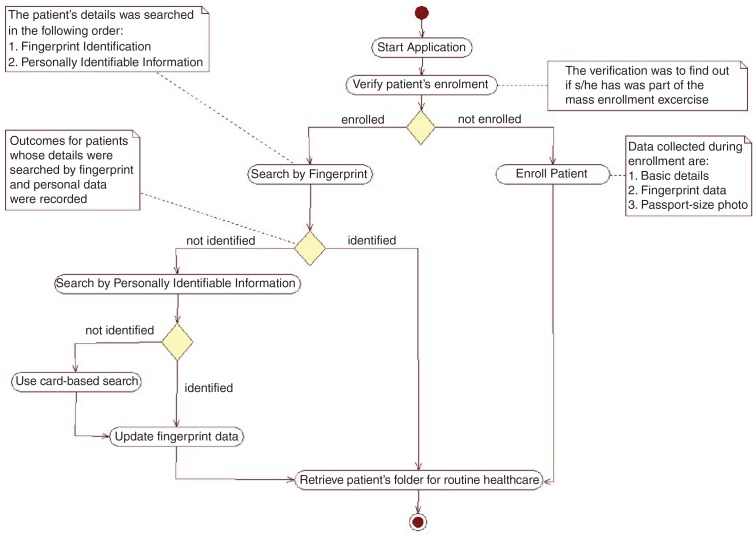
Fig. 1.
Activity diagram for the identification process. The solid circle at the top of the flow diagram indicates the start of the process. The colored rectangles with curved edges indicate the major steps in the activity. The diamond shapes in the flow diagram represent points of decision in the activity; the arrows show the sequence and directions of the activity. The plain (white) rectangles provide more explanation for some of the processes. These plain rectangles are linked to the processes they explain by dotted lines; the solid circle with a white ring around it indicates the end of the activity.

