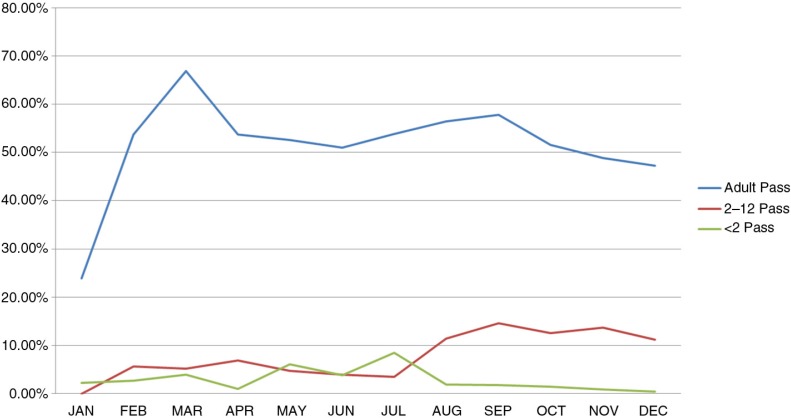
Fig. 4.
Age grouping for visits successfully identified by fingerprint for the year 2012. The x-axis categorizes the number of successful identifications by month. The values on the y-axis are percentage rates over the total number of visits searched by fingerprints for the given month. The bar graphs indicate the percentage of patient visits from three age groupings for which fingerprint identification was successful. The blue bar graphs represent age groupings from 13 years and above, the red bars represent age groupings from 2 years to 12 years, and the green bars represent age groupings of children under 2 years.

