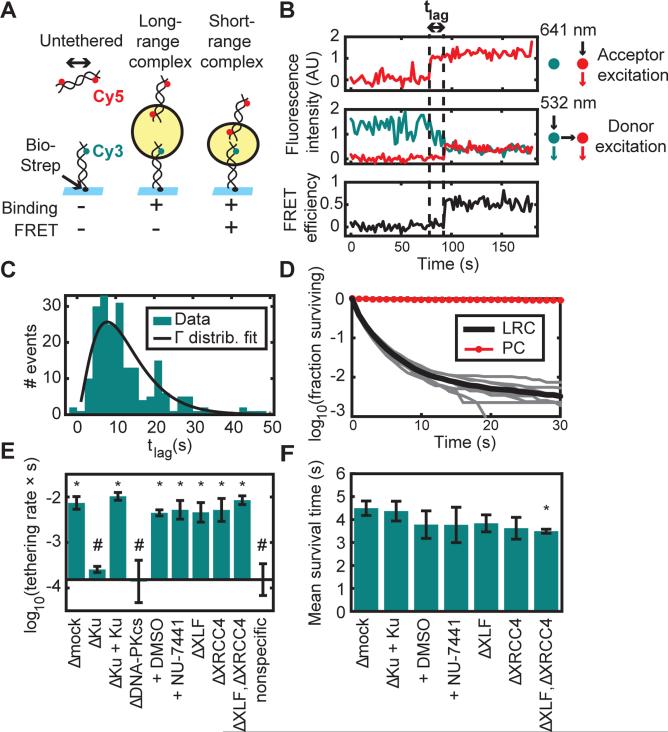
Figure 2. Two-Stage Synapsis of DNA Ends.
(A) Schematic of the intermolecular tethering assay. A 100-base pair (bp) DNA duplex biotinylated at one end (Bio) and labeled 7 bp from the other end with Cy3 was attached to a glass surface coated with streptavidin (Strep). A second 100-bp duplex labeled 7 bp from each end with Cy5 was added to egg extract and introduced into the flowcell. Cy5-DNA binding and FRET were monitored by alternating excitation of Cy3 and Cy5. The yellow circle represents the protein complex that bridges DNA ends.
(B) Example trajectory showing a lag time (tlag) between Cy5-DNA binding and transition to a high-FRET state. Upper panel, Cy5 signal with Cy5 (641 nm) excitation, which appears upon Cy5-DNA binding to the stationary Cy3-DNA. Middle panel, Cy3 (cyan) and Cy5 (red) signal with Cy3 (532 nm) excitation. Lower panel, calculated FRET efficiency.
(C) Histogram of lag times between binding and transition to high FRET (N = 207 trajectories). A fit to a gamma distribution (k = 2.7, θ = 4.7 s) suggests that multiple steps are required for the long- to short-range transition, each with a time constant on the order of seconds.
(D) Survival curve of long-range complexes (LRC) in mock-immunodepleted extract (N = 57921 events) and biotinylated Cy5-DNAs as a photostability control (PC; N = 3907 molecules). The thick black line shows the mean of nine experimental replicates (thin gray lines).
(E) Long-range complex formation rate in extract immunodepleted of different factors or treated with DNA-PK inhibitor (NU-7441) or vehicle (DMSO). Elements of the two sets of conditions labeled * and # are significantly different from elements of the other set but not from elements of the same set (p < 10−5, ANOVA with Tukey's post-hoc test). Error bars: ±2*S.E.M. See Table S1 for sample sizes.
(F) Mean survival time of tethered complexes was similar among different conditions, although slightly reduced by XLF/XRCC4 double-depletion (p = 0.03 compared to Δmock, ANOVA with Tukey's post-hoc test). Error bars: ±2*S.E.M. XLF and XRCC4 depletion also appeared to reduce the fraction of long-range complexes that were extremely long-lived (see Fig. S2D).
See also Figure S2 and Table S1.

