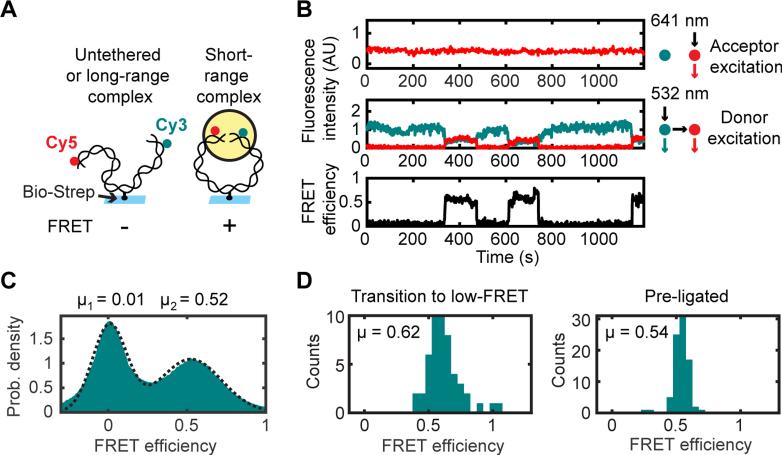
Figure 3. Single-Molecule Circularization Assay.
(A) A 2-kilobase pair (kb), blunt-ended DNA labeled 7 bp from one end with Cy3 and 7 bp from the other end with Cy5 was tethered by an internal biotin-streptavidin attachment to a glass coverslip, and FRET between Cy3 and Cy5 was measured after egg extract was added to the flowcell.
(B) Multiple transitions on a single substrate between low and high FRET. Top panel, Cy5 fluorescence intensity with direct (641 nm) excitation. Middle panel, Cy3 (cyan) and Cy5 (red) fluorescence with Cy3 (532 nm) excitation. Lower panel, FRET efficiency.
(C) Histogram of FRET efficiencies in mock-immunodepleted extract, compiled over all substrates and all frames in three 30-min timecourse experiments (n = 434397 substrates * frames).
(D) Histograms of average FRET efficiencies from high-FRET segments of long timecourse trajectories. Left panel, high-FRET complexes in extract that subsequently transitioned to a low-FRET state (indicating that they were unligated; N = 50 trajectory segments). Right panel, gel-purified circular standard generated by T4 DNA ligase (N = 83 trajectory segments).
See also Figure S3.

