
Figure 4. Distributions of mean glucose concentrations and insulin doses.
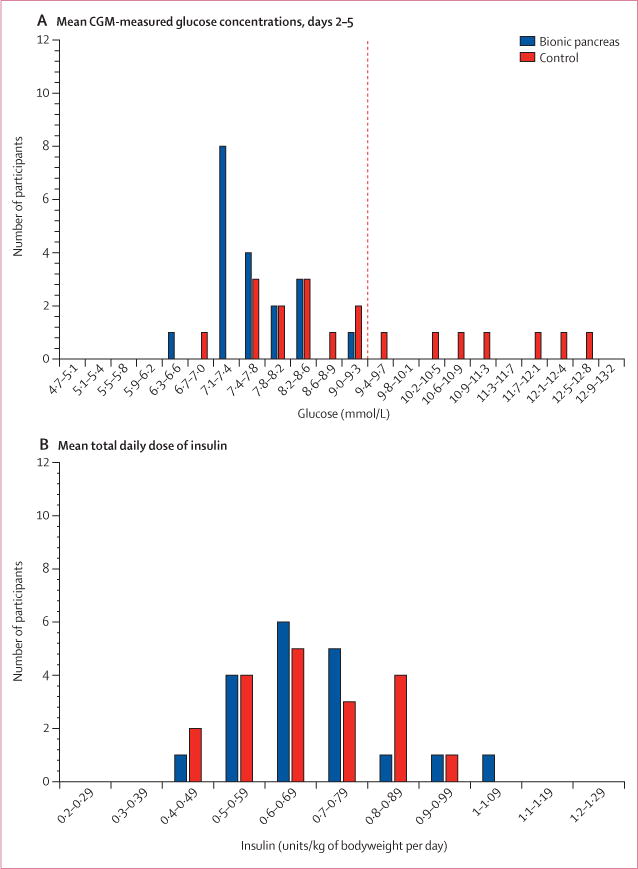
(A) Histogram distribution of mean CGM-measured glucose concentrations per participant on days 2–5 during the bionic pancreas and control periods, with mean glucose concentrations divided into intervals of 0·39 mmol/L. The dashed red line shows the mean glucose concentration of 9·4 mmol/L, which corresponds to a predicted HbA1c of 7·5%. (B) Histogram distribution of mean total daily doses of insulin on days 2–5, divided into intervals of 0·1 units/kg of bodyweight per day. To convert the values for glucose to mg/dL, multiply by 18. CGM=continuous glucose monitoring.