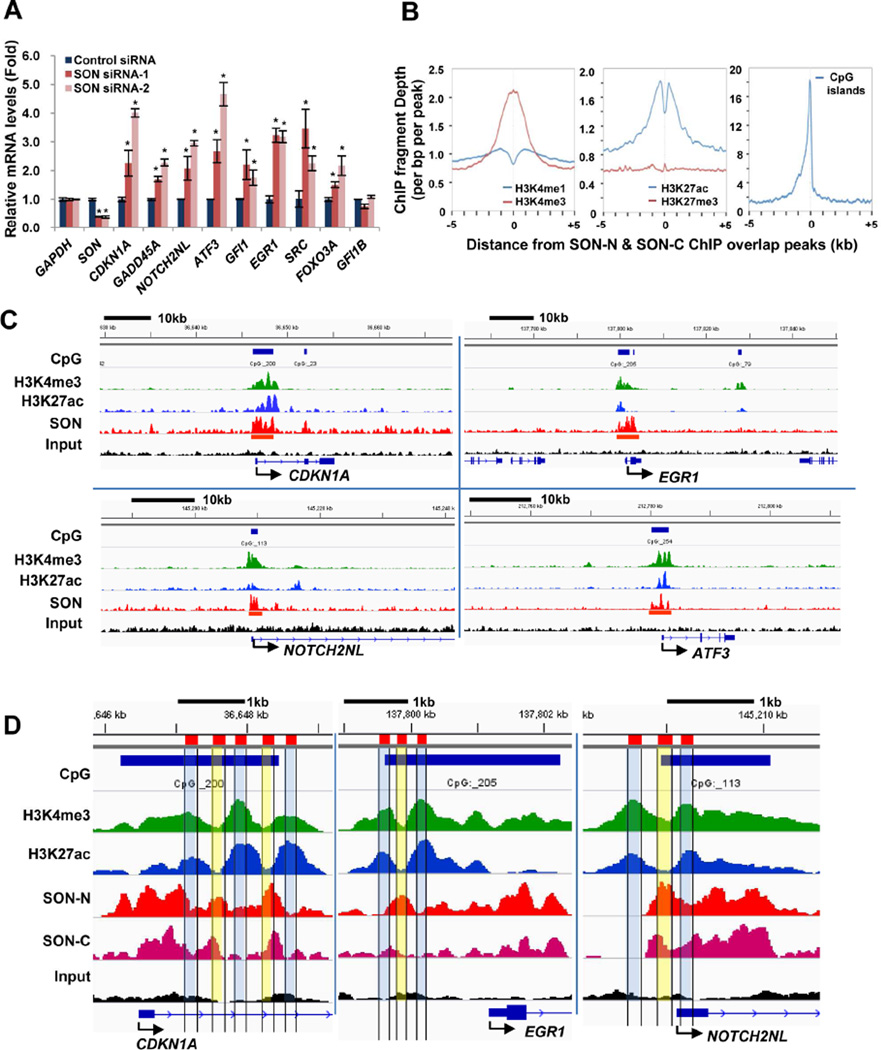
Figure 2. SON Depletion Increases Target Gene Expression and SON-Binding Sites Are Closely Associated with the Location of H3K4me3.
(A) qPCR analyses of SON ChIP-seq target genes in K562 cells transfected with control siRNA and two different SON siRNAs. GFI1B served as a negative control which does not have SON binding sites near the TSS. Values represent mean ± SD of four independent experiments. *p < 0.01.
(B) Average signal profiles of indicated histone modifications and CpG islands around the SON-binding sites.
(C) Integrative Genomics Viewer (IGV) images representing SON (SON-N), H3K4me3, and H3K27ac ChIP-seq read counts at the target gene locus in K562 cells. The CpG island area is indicated by blue bars on top of each panel, and the location of “called peaks” from SON ChIP-seq analyses are marked with red bars.
(D) Close-up images of ChIP-seq peaks of SON-N, SON-C, H3K4me3, and H3K27ac in representative SON target genes. The areas with high H3K4me3 level (H3K4me3 peaks) and low SON level (SON valleys) are indicated in blue, and the areas with low H3K4me3 (H3K4me3 valleys) and high SON (SON peaks) are indicated in yellow. See also Figure S2.

