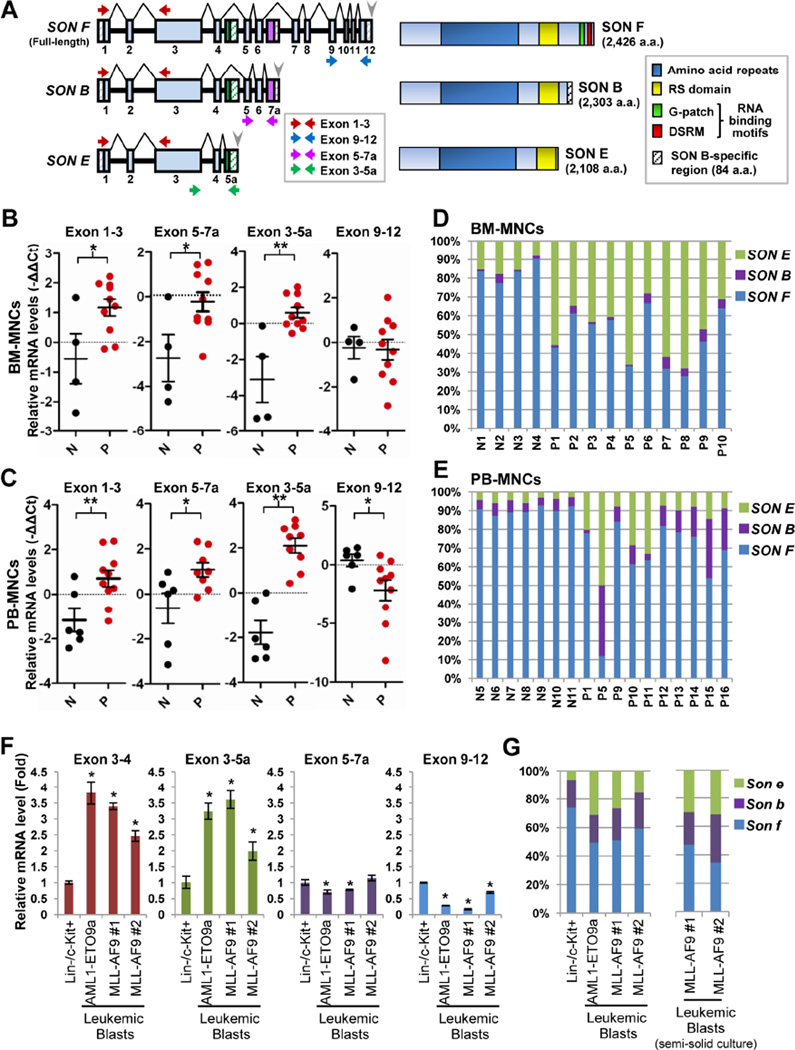
Figure 5. Two Different Alternatively Spliced Isoforms, SON B and E, Are Aberrantly Upregulated in Human AML Patients and Mouse Models of AML.
(A) Schematic representation of the SON gene and the SON proteins. Full-length SON (SON F) is generated by alignment of 12 constitutive exons (sky blue). Inclusion of alternative exons (exon 7a, labeled in purple and exon 5a, labeled in green) produces two different alternatively spliced isoforms, SON B and E. Horizontal arrows indicate the specific position of the primers used in qPCR shown in panels B and C. Gray arrowheads, polyadenylation signal sequences; Hatched boxes, untranslated regions.
(B and C) qPCR analysis of specific exon regions of SON in BM-MNCs of AML patients (P, red dots; n = 10) and healthy normal donors (N, black dots; n = 4) (B), and PB-MNCs of AML (n = 8) and MDS (n = 2) patients (P) and healthy normal donors (N; n = 7) (C). GAPDH was used for normalization. Black horizontal bars indicating the median expression level of specific exon regions of SON are presented with the error bars indicating ±SD. *p < 0.05, **p < 0.01.
(D and E) Relative ratio of SON F, SON B and SON E in the BM-MNCs from AML patients (P1 – P10) and healthy normal donors (N1 – N4) (D), and PB-MNCs from AML patients (P1, P5, P9–14), MDS patients (P15 – 16) and healthy normal donors (N5 – N11) (E) are determined by the method described in Figure S5D.
(F and G) Analyses of SON isoform expression in normal mouse Lin−/c-Kit+ bone marrow (BM) cells and leukemic blasts from mice with AML1-ETO9a- and MLL-AF9-induced leukemia. Specific exon regions indicated in each graph were determined by qPCR (F) with the primer sets indicated in Figure S5A. Data are represented as mean ± SD of three independent experiments. *p < 0.01. Relative ratios of three forms of Son in leukemic blasts (freshly isolated from the animals and also collected after methylcellulose culture) and normal Lin−/c-Kit+ mouse BM cells were determined (G). See also Tables S1 and S2 and Figure S5.

