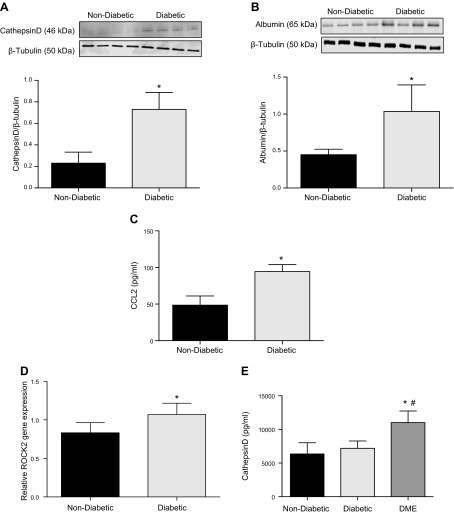
Figure 7.
CD levels are increased in the retinas of diabetic mice and serum of patients with DME. A) Albumin levels in retinal tissue as measured by Western blot in diabetic animals compared with nondiabetic animals. *P = 0.04, significantly greater than nondiabetic animals (n = 4). B) Representative Western blot image of CD and β-tubulin in the retinas of nondiabetic and 4-mo-old diabetic mice. Band density quantitation demonstrates significantly elevated levels of CD protein in the retinas of diabetic mice compared to nondiabetic animals. *P = 0.003, significantly greater than nondiabetic animals (n = 4). C) CCL2 levels measured by ELISA from diabetic mouse retinas were significantly higher than CCL2 levels in the retinas of nondiabetic mice (n = 4). *P = 0.001, significantly greater than nondiabetic mouse retinas. D) ROCK2 gene expression levels, measured by real-time PCR, show significantly increased levels in the retinas of diabetic mice compared to nondiabetic animals (n = 4). *P = 0.03, significantly greater than nondiabetic animals. E) Age-adjusted mean values of CD levels measured by ELISA from human serum samples showed significantly elevated levels in patients with DR (DME) compared to nondiabetic subjects or diabetic subjects without DME (n = 11). Data are represented as means ± sd. *P < 0.0001, significantly greater than nondiabetic subjects; #P < 0.0001, significantly greater than diabetic subjects without DME.

