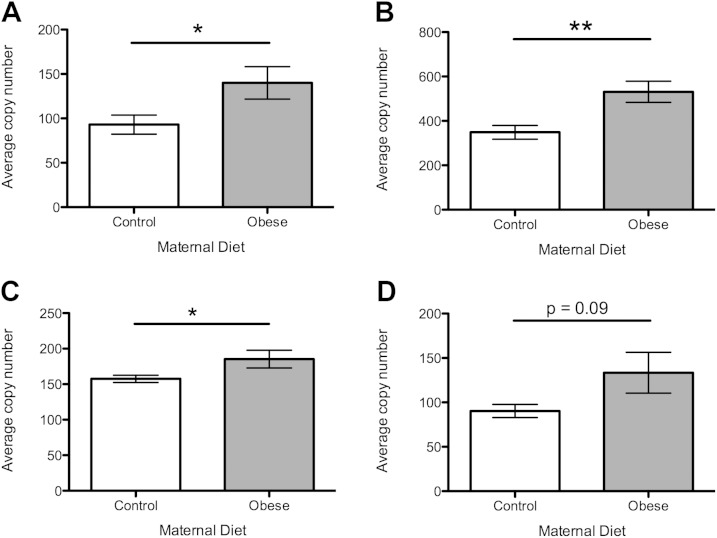
Figure 5.
Expression of genes coding for mitochondrial anti-oxidant defenses. Open bars represent maternal control diet, gray bars represent maternal obesogenic diet. A) Expression of MnSOD. B) Expression of Gpx4. C) Expression of CuZnSOD. D) Expression of Ccs. n = 8 per group. *P < 0.05, **P < 0.01.

