Figure 2.

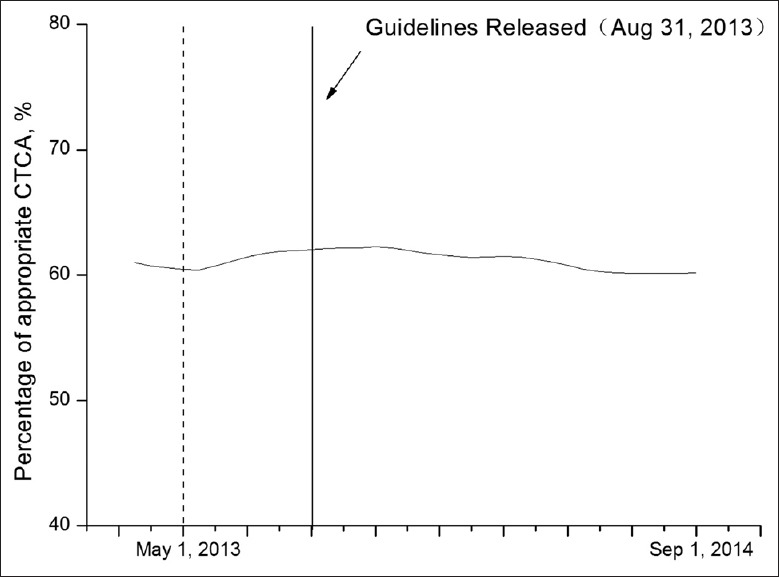
Rate of appropriate coronary computed tomographic angiography over time. The rate of appropriate coronary computed tomographic angiography over the study period is shown for the overall study population.

Rate of appropriate coronary computed tomographic angiography over time. The rate of appropriate coronary computed tomographic angiography over the study period is shown for the overall study population.