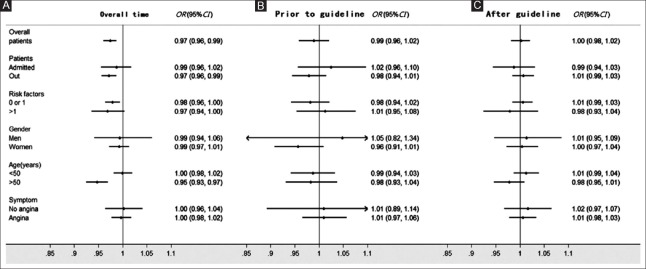
Figure 3.
Odds ratios for change in the rate of appropriate coronary computed tomographic angiography in different subgroups, per 15-day period. (A) Overall time. (B) Prior to the guideline. (C) After guideline. The final model was adjusted for gender, age, number of other risk factors, pretest probability, ejection fraction, appropriate stress test, patients (admitted and out), and symptom. CI: Confidence interval; OR: Odds ratio.

