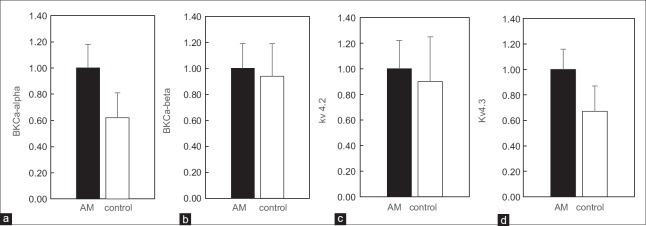
Figure 3.
The relative mRNA expression in adenomyosis (AM) and the control group. The expression of BKCa-alpha (a) was significantly increased in myometrium of AM compared to the control group (P < 0.05), so was Kv4.3 (d). The relative expression of mRNA for BKCa-beta (b) and Kv4.2 (c) showed no statistically significant difference.

