Figure 2.

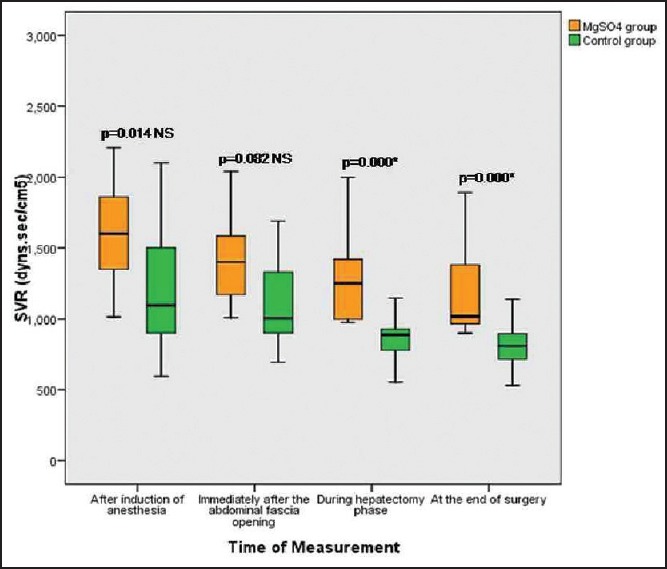
Box and whiskers graph of systemic vascular resistance (dyns.s/cm5) in the two studied groups, *significant P < 0.01, NS: Nonsignificant

Box and whiskers graph of systemic vascular resistance (dyns.s/cm5) in the two studied groups, *significant P < 0.01, NS: Nonsignificant