Figure 4.

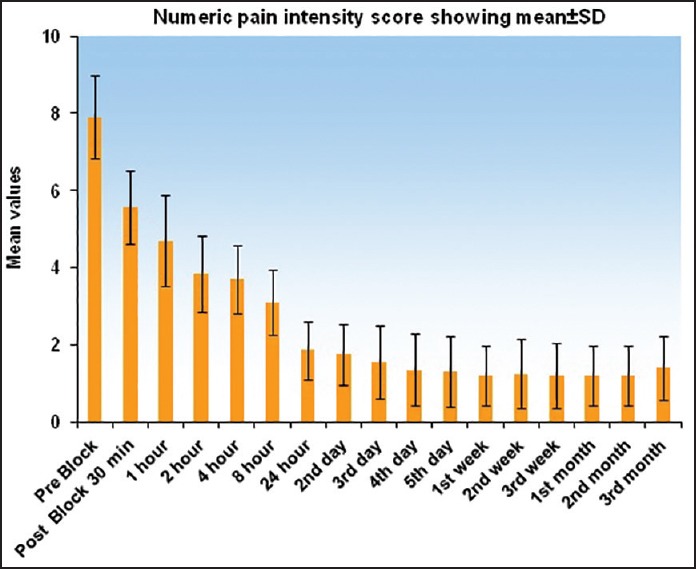
Graph showing numeric pain intensity score (0-10) at various time intervals. Graph shows decreasing trend in the score and a slight rise at 3rd month

Graph showing numeric pain intensity score (0-10) at various time intervals. Graph shows decreasing trend in the score and a slight rise at 3rd month