Figure 5.

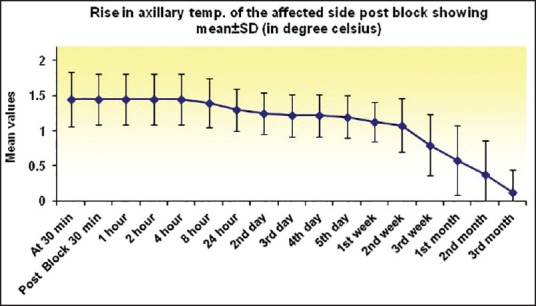
Graph showing a change in axillary temperature of affected limb at various time intervals. Sustained rise was observed up to 2nd week, and it decreased thereafter, but did not reach the baseline until 3rd month

Graph showing a change in axillary temperature of affected limb at various time intervals. Sustained rise was observed up to 2nd week, and it decreased thereafter, but did not reach the baseline until 3rd month