Figure 7.

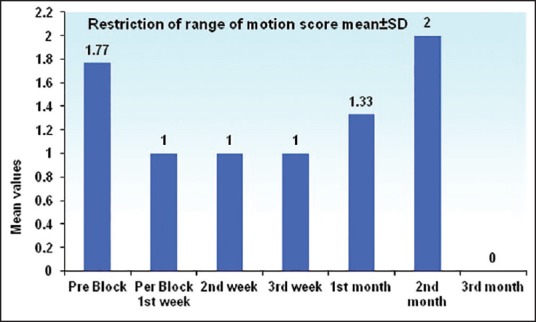
Histogram for restriction of range of motion for affected joints of upper limb at different time intervals n= 13 up to 3 weeks, n= 3 at 1st month, n= 1 at 2nd month, and n= 0 at 3rd month

Histogram for restriction of range of motion for affected joints of upper limb at different time intervals n= 13 up to 3 weeks, n= 3 at 1st month, n= 1 at 2nd month, and n= 0 at 3rd month