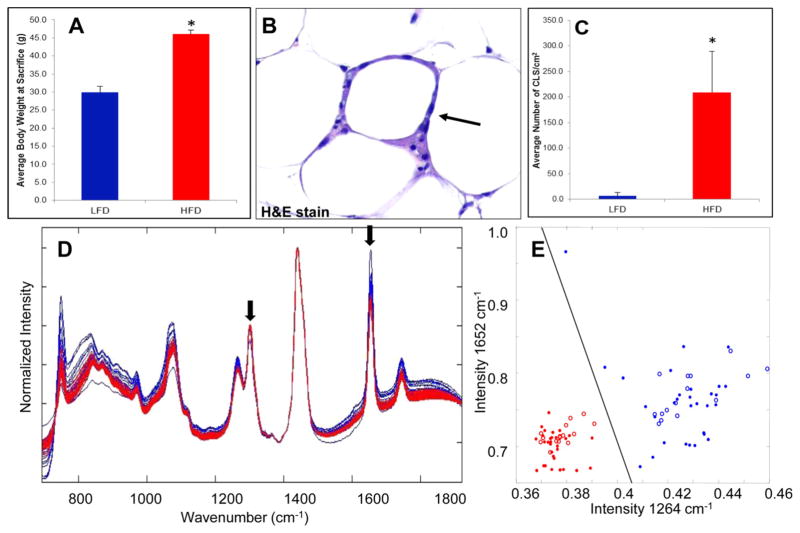
Figure 1.
Raman spectroscopy detects WATi in epididymal fat from a mouse model of diet-induced obesity with perfect accuracy. (A) Average body weights of mice on the LFD (noninflamed) and HFD (inflamed) at the time of sacrifice (n = 10/group). (Asterisk (*) denotes P < 0.001.) (B) A CLS in WAT from a mouse on the HFD stained with H&E. (C) Average number of CLS/cm2 in mice on the LFD and HFD. (Asterisk (*) denotes P < 0.001.) (D) Raman spectra from inflamed (red, HFD) and noninflamed (blue, LFD) epididymal WAT. Clear differences in the spectra of inflamed and noninflamed WAT can be seen, particularly in the intensity of the Raman peaks at 1264 and 1652 cm−1 (see arrowed features). (E) Diagnostic scatter plots based on the peak heights of the 1264 and 1652 cm−1, which can separate inflamed (red) from noninflamed (blue) WAT with 100% accuracy (data shown as closed circles). Data were also collected in a blinded prospective manner from contralateral epididymal fat from the same mice (n = 5/group) and diagnoses were provided based on the intensity of the 1264 and 1652 cm−1 Raman peaks. Using the algorithm in a prospective manner, Raman spectroscopy could correctly identify the inflammatory state of all 10 mice examined. These data are shown as red and blue open circles on the diagnostic scatter plot in panel (E).

