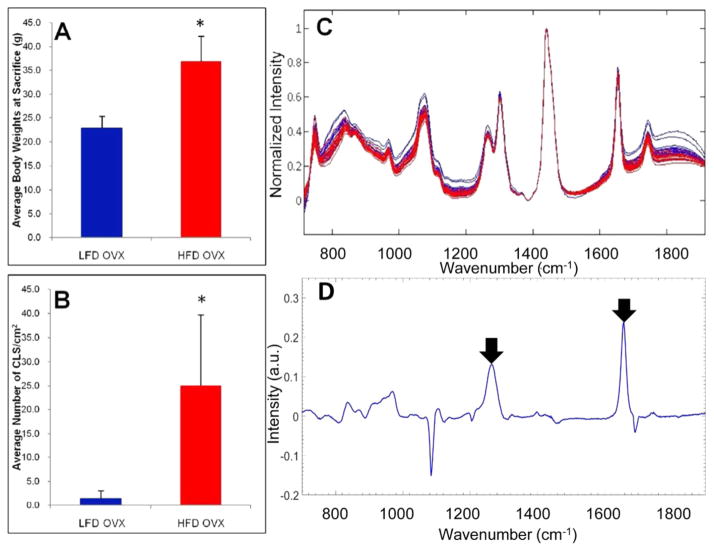
Figure 3.
Raman spectroscopy detects WATi in mammary tissue from a mouse model of post-menopausal diet-induced obesity with high accuracy. (A) Average body weights of ovariectomized LFD (noninflamed) and ovariectomized HFD (inflamed) female mice (n = 10/group), and (B) average number of CLS/cm2 in each group of mice. (In panels (A) and (B), the asterisk (*) denotes P < 0.001.) (C) Raman spectra from inflamed (red, HFD) and noninflamed (blue, LFD) mammary WAT. (D) PC5, which is a diagnostic principal component (PC), contains Raman peaks at 1264 and 1652 cm−1, which are also found to be diagnostic in other datasets (see arrowed features).

