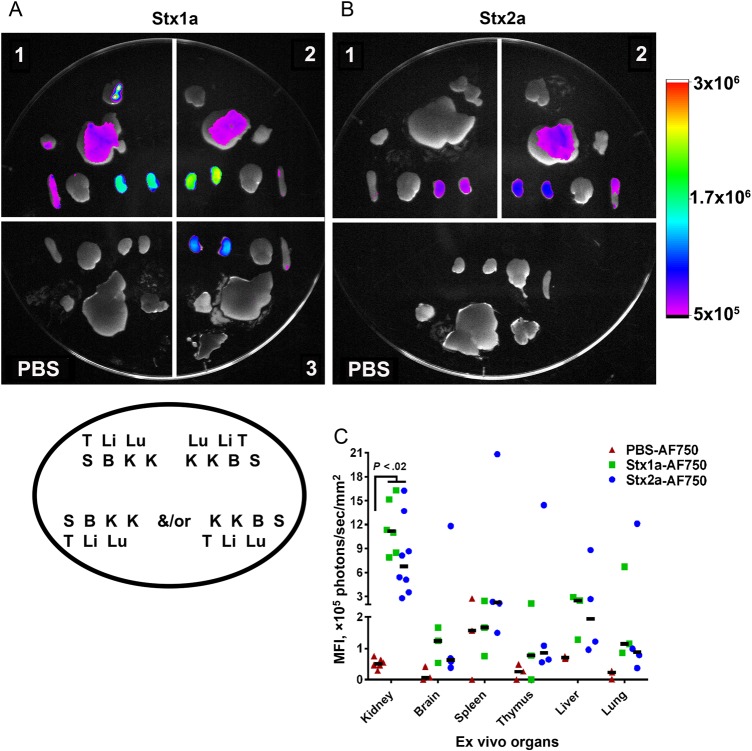
Figure 1.
Fluorescence of ex vivo organs from mice intoxicated with Shiga toxin 1a (Stx1a)–AF750 (A) and Stx2a-AF750 (B) 6 hours after intoxication. Stx1a and Stx2a exhibited a similar dissemination pattern 6 hours after intoxication, with the greatest fluorescent intensity in the kidneys. A and B, Each number represents an individual experimental mouse; Stx1a-AF750: n = 3; Stx2a-AF750: n = 4 (2 biological replicates; the second replicate is depicted). Organ placement for all samples follow the legend depicted in the oval under panel A. B, brain; K, kidney; Li, liver; Lu, lung; S, spleen; T, thymus. The intensity scale to the right is equivalent for both images. C, Quantification of fluorescent intensity of ex vivo organs. The mean fluorescence intensity (MFI) was statistically greater in the kidneys of Stx1a-intoxicated and Stx2a-intoxicated mice as compared to phosphate-buffered saline (PBS)–treated controls (P < .02). There was no statistical difference between Stx1a-AF750 and Stx2a-AF750 in any organ (P > .08). Statistical significance was determined by the Kruskal–Wallis test with the Dunn correction for multiple comparisons. Each symbol is an individual organ; left and right kidneys are included separately. The black bar represents the median value.

