Fig. 4.
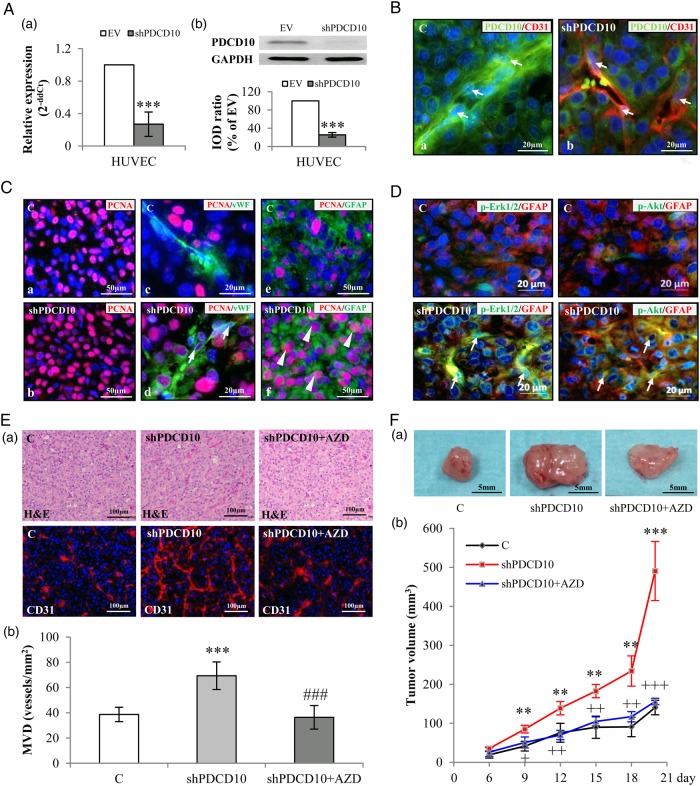
Endothelial knockdown of PDCD10 stimulated neo-angiogenesis and tumor growth in a human glioblastoma (GBM) xenograft model in mice. The xenograft tumors were resulted from the mixtures of U87 and EV-transduced human umbilical vein endothelial cells (HUVECs) (C) or U87 and shPDCD10-HUVECs (shPDCD10). shPDCD10 mice (shPDCD10+AZD) were treated with AZD2171 (3 mg/kg, i.g.) beginning on the sixth day of implantation for 14days (n = 4); C and shPDCD10 mice received vehicle only (n = 4 for each group). The xenograft tumors were removed from the mice after 20 days of implantation. (A) Confirmation of PDCD10 knockdown at mRNA (a) and protein levels (b) in HUVECs before mice implantation. *** P < .001, compare to EV. (B) Stable knockdown of endothelial PDCD10 in xenograft tumors. Double-staining indicated absence of PDCD10 in CD31-positive cells (red) in tumors formed by U87 and shPDCD10-HUVECs (shPDCD10-mice) (arrows in b), whereas co-expression of PDCD10 (green) and CD31 (red) was detected in ECs of tumors formed by U87 and EV-HUVECs (C) (arrows in a). Scale bar: 20 µm. (C) Endothelial knockdown of PDCD10 facilitated tumor cell proliferation. Immunofluorescent staining indicated extensive PCNA immunoreactivity (red) in shPDCD10-mice (b) compared with the control (a). Double staining showed that ECs (arrows in d) and GFAP-positive tumor cells (arrowheads in f) were undergoing a more massive proliferation in shPDCD10-mice as compared with the controls (c and e). Scale bar: 50 µm in a, c, d and f; 20 µm in b and e. (D) Endothelial deletion of PDCD10 activated Erk1/2 and Akt in xenograft tumor cells. Double-staining demonstrated the activation of Erk1/2 (green) or Akt (green) in GFAP-positive GBM cells (red) of xenograft tumors from shPDCD10-mice (arrows). Scale bar: 20 µm. (E) Endothelial knockdown of PDCD10 stimulated neo-angiogenesis, which was reversed by the treatment of mice with AZD. Both H&E staining and CD31-immunofluorescent staining (a) revealed increased microvessel density (MVD) with more branches in xenograft tumors of shPDCD10-mice compared with control. The neo-angiogenic features induced by shPDCD10 were reversed by AZD treatment. Quantitative analysis of MVD is shown in b. *** P < .001, compare to C; ### P < .001, compare to shPDCD10. Scale bar: 100 µm. (F) Co-implantation of U87 and shPDCD10-HUVECs promoted tumor growth that was abolished by the treatment of mice with AZD. The representative photos show the tumors from control-, shPDCD10-mice, and AZD-treated shPDCD10-mice on day 20 after implantation (a). Scale bar: 5 mm. The tumor growth curve is shown in b. ** P < .01 and *** P < .001, compare to C; + P < .05, ++ P < .01 and +++ P < .001, compare to shPDCD10.

