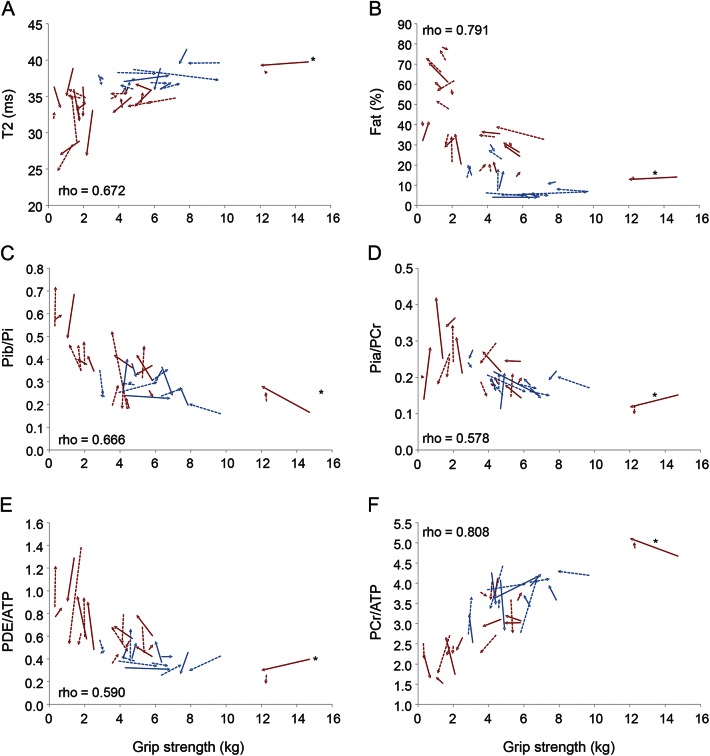
Figure 2. Correlations between grip strength and nuclear magnetic resonance variables.
Variables plotted against grip strength: T2 (A), % fat (B), anomalous alkaline pool present in dystrophic muscle (Pib)/inorganic phosphate (Pi) (C), cytosolic inorganic phosphate (Pia)/phosphocreatine (PCr) (D), phosphodiester (PDE)/adenosine triphosphate (ATP) (E), and PCr/ATP (F). Spearman correlations. Ambulatory patients represented in blue; nonambulatory patients in red. *The patient with more preserved strength, considered an outlier.

