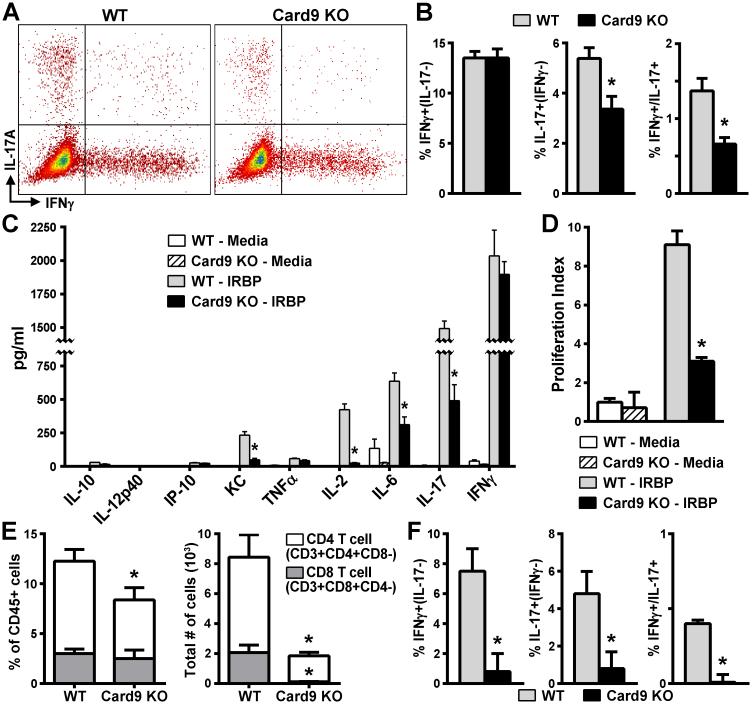
Figure 2. Card9 promotes polarization of the Th17 cellular response to IRBP.
In vitro-stimulated cultures prepared from Card9 KO and WT mice at d21 post-immunization were analyzed for antigen-specific responses. Flow cytometric analysis (dot plot, panel A) showing frequency of IFNγ+, IL-17+, or double-positive cells among IRBP-stimulated CD4+ cell effector populations that were quantified (B; n=6-10 mice/experiment, experiment performed 3 times). C) Cytokine concentration in culture supernatants was determined at 48 h post IRBP-stimulation by multiplex ELISA (Luminex® assay) (n=8-10 mice/group; data are average of 3 independently performed experiments). D) Proliferative responses of IRBP-specific T cells from WT or Card9 KO mice were assessed 72 h later by 3H-thymidine incorporation (n = 6 mice/group, representative of 3-independently performed experiments). Values are C.P.M. plotted as fold induction to media controls. Panels E-F) Flow cytometric analysis of T cell populations within eyes of mice d21 post-immunization that were evaluated for composition and number of CD45+ gated cells (E; n=10 mice/group, experiment performed 3 times). CD4+ T subsets were further evaluated by intracellular cytokine staining for IFNγ+, IL-17+, or double-positive cells (F) (n=10 mice/groups, experiment performed 3 times). *p<0.05 vs WT response.

