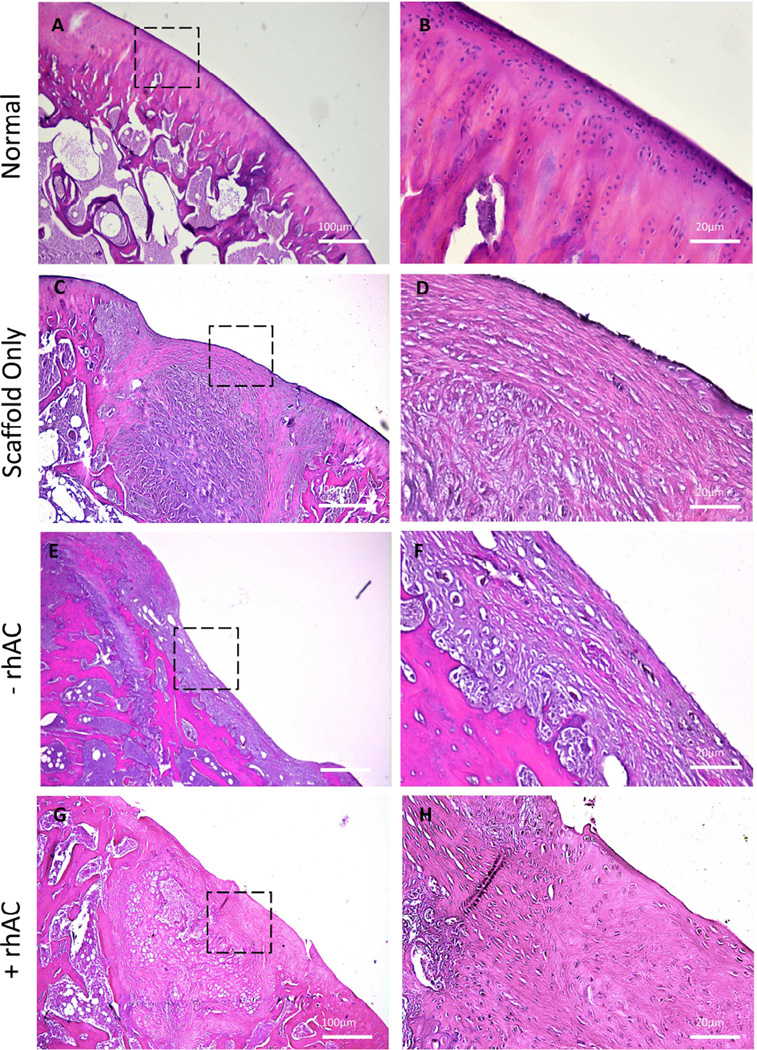
Figure 5.
H&E staining of normal cartilage (A and B), implants containing Bio-Gide® alone (C and D), chondrocytes without rhAC treatment (E and F), and chondrocytes with rhAC treatment (G and H). Dotted boxes represent the region from 4× that is depicted at 20×. Small, rounded chondrocyte-like cells also were evident in scaffolds with rhAC treated cells (H, arrow). Scale bars = 100µm for 4× magnification (A, C, E and G) and 20µm for 20× magnification (B, D, F and H).

