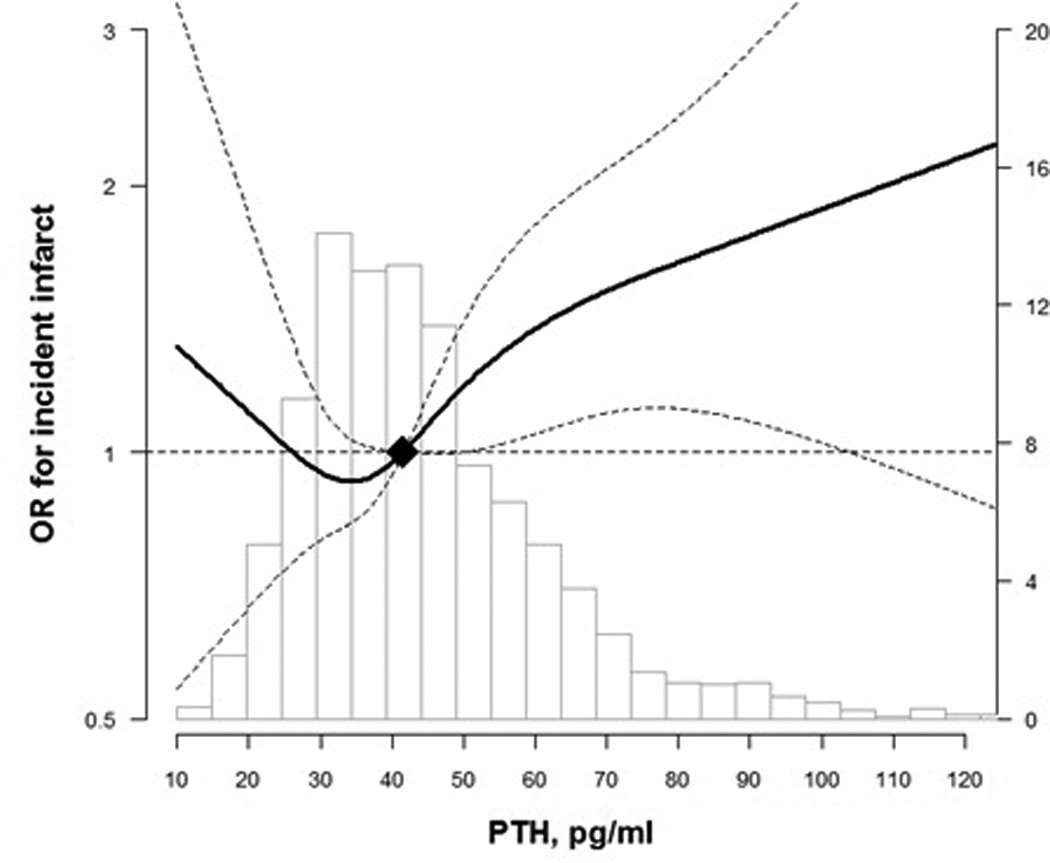
Figure 4.

OR for incident infarct by PTH level from visit 3 to Brain MRI visit
Curves represent adjusted change (solid lines) and their 95% confidence intervals (dashed lines) based on restricted cubic splines for PTH and brain MRI outcomes with knots at the 5th, 35th, 65th and 95th percentiles of their sample distributions. The reference values (diamond dots) were set at the 50th percentile level (41.7 pg/ml). Models were adjusted for age, sex, race, education, body mass index, smoking status, alcohol drinking, and physical activity
