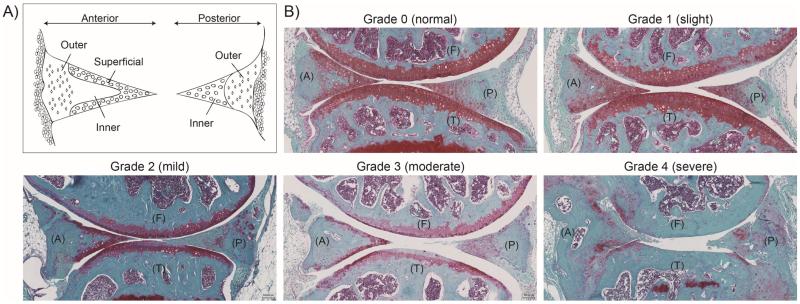
Figure 3.
(A) Diagram demonstrating the different regions of the anterior and posterior portions to be scored by histological assessment. (B) Representative images of histopathological grade 0 through 4, showing the femur (F), tibia (T) as well as anterior (A) and posterior (P) location of the menisci (Safranin O staining). Grades were converted from the total scores from the histological assessment: Grade 0 = 0 – 4, Grade 1 = 5 – 9, Grade 2 = 10 – 14; Grade 3 = 15 – 19; Grade 4 = 20 – 24.

