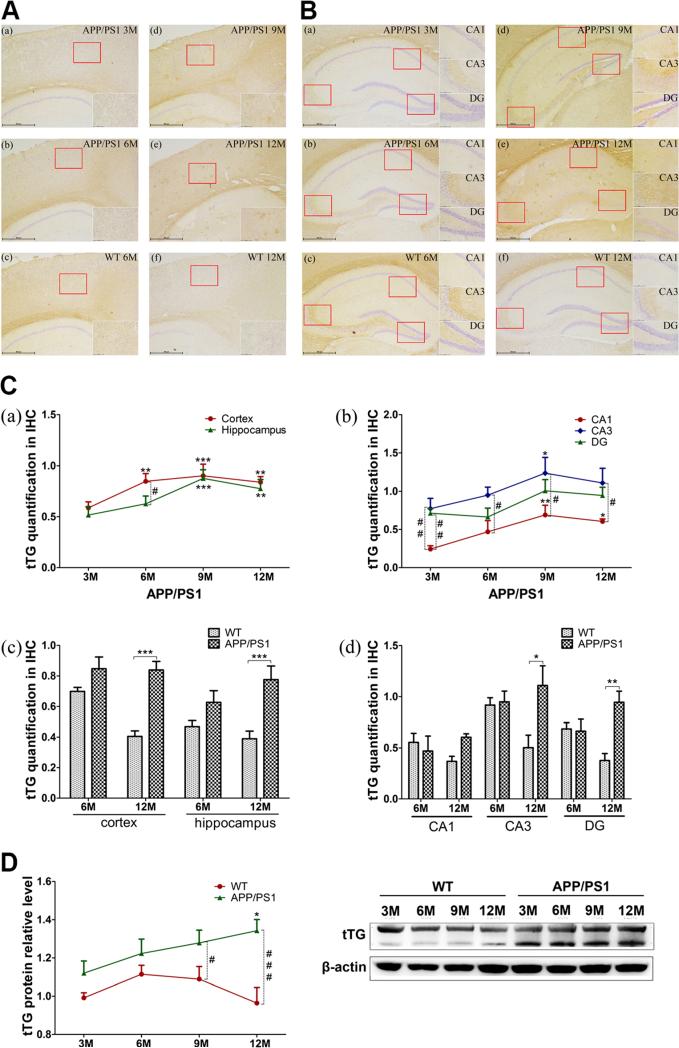
Fig. 3.
Alterations of tTG in APP/PS1 and WT mice. A, B Immunohistochemistry of tTG quantification level by SP-DAB method in 3M (a), 6M (b), 9M (d), and 12M (e) APP/PS1 transgenic mice or 6M (c), 12M (f) WT mice cortex (A), and hippocampus (B). The repres entative photos of tTG with ×40 and ×200 magnification are shown. C Data acquisition from tTG slices. The average signal intensity (IOD/AOI) of tTG in the cortex and hippocampus was calculated by using Image-Pro Plus 6.0 software. Six sections from cortex and seven from hippocampus in each region, with three mice in each group, were analyzed. Cortical and hippocampal total levels (a, c) and hippocampal typical regions’ (CA1, CA3, DG) levels (b, d) are showed on the graph. D Western blotting of tTG in 3M, 6M, 9M, and 12M APP/PS1 and WT mice (n=6 for each group). Images were detected on Bio Imaging System (DNR Lumi BIS) via ECL system and analyzed by Image-Pro Plus 6.0. The figure is the representative bands of tTG and β-actin Western blotting. Statistical data is expressed as mean±SEM from independent experiments group. *P<0.05, **P<0.01, ***P<0.001 vs. 3 M groups or WT controls. #P<0.05, ##P<0.01, ###P<0.001 vs. WT controls

