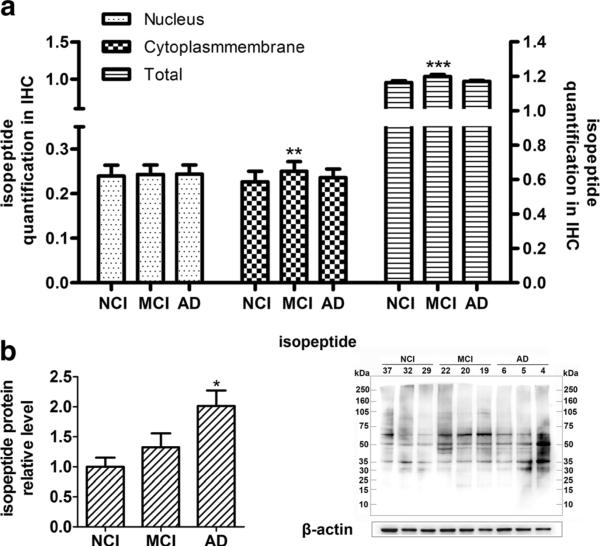
Fig. 4.
Alterations of isopeptide protein level in NCI, MCI, and AD. a Quantification of isopeptide immunohistochemical staining in NCI, MCI, and AD. Four sections with five samples in each group were analyzed. Resolution spectra images were quantitatively analyzed using art imaging systems Vectra™ (Caliper Life Sciences, Inc, Hopkinton, MA). Average positive OD values from roughly 150–300 cells were summarized. b Western blotting of isopeptide in NCI, MCI, and AD. Images were detect on Bio Imaging System (DNR Lumi BIS) via ECL system and analyzed by Image-Pro Plus 6.0 (n=10 for each group). Statistical data is expressed as mean±SEM from independent experiments group. *P<0.05, **P<0.01, ***P<0.001 vs. NCI group

